
 Yahoo Finance
 A Note On National Storage Affiliates Trust's (NYSE:NSA) ROE and Debt To Equity
While some investors are already well versed in financial metrics (hat tip), this article is for those who would like to learn about Return On Equity (ROE) and why it is important. By way of learning-by-doing, we'll look at ROE to gain a better understanding of National Storage Affiliates Trust (NYSE:NSA).
Return on Equity or ROE is a test of how effectively a company is growing its value and managing investors’ money. In simpler terms, it measures the profitability of a company in relation to shareholder's equity.
View our latest analysis for National Storage Affiliates Trust
How To Calculate Return On Equity?
The formula for return on equity is:
Return on Equity = Net Profit (from continuing operations) ÷ Shareholders' Equity
So, based on the above formula, the ROE for National Storage Affiliates Trust is:
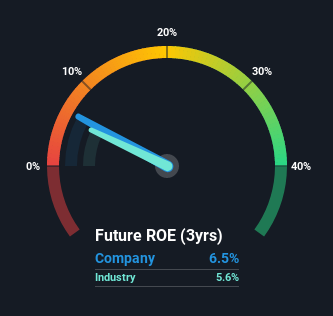
6.5% = US$109m ÷ US$1.7b (Based on the trailing twelve months to June 2021).
The 'return' is the income the business earned over the last year. So, this means that for every $1 of its shareholder's investments, the company generates a profit of $0.06.
Does National Storage Affiliates Trust Have A Good Return On Equity?
Arguably the easiest way to assess company's ROE is to compare it with the average in its industry. Importantly, this is far from a perfect measure, because companies differ significantly within the same industry classification. The image below shows that National Storage Affiliates Trust has an ROE that is roughly in line with the REITs industry average (5.6%).
That isn't amazing, but it is respectable. Even if the ROE is respectable when compared to the industry, its worth checking if the firm's ROE is being aided by high debt levels. If true, then it is more an indication of risk than the potential. You can see the 3 risks we have identified for National Storage Affiliates Trust by visiting our risks dashboard for free on our platform here.
How Does Debt Impact ROE?
Companies usually need to invest money to grow their profits. That cash can come from issuing shares, retained earnings, or debt. In the case of the first and second options, the ROE will reflect this use of cash, for growth. In the latter case, the use of debt will improve the returns, but will not change the equity. That will make the ROE look better than if no debt was used.
Combining National Storage Affiliates Trust's Debt And Its 6.5% Return On Equity
National Storage Affiliates Trust clearly uses a high amount of debt to boost returns, as it has a debt to equity ratio of 1.25. The combination of a rather low ROE and significant use of debt is not particularly appealing. Debt increases risk and reduces options for the company in the future, so you generally want to see some good returns from using it.
Conclusion
Return on equity is useful for comparing the quality of different businesses. A company that can achieve a high return on equity without debt could be considered a high quality business. If two companies have the same ROE, then I would generally prefer the one with less debt.
But ROE is just one piece of a bigger puzzle, since high quality businesses often trade on high multiples of earnings. Profit growth rates, versus the expectations reflected in the price of the stock, are a particularly important to consider. So you might want to take a peek at this data-rich interactive graph of forecasts for the company.
Of course, you might find a fantastic investment by looking elsewhere. So take a peek at this free list of interesting companies.
This article by Simply Wall St is general in nature. We provide commentary based on historical data and analyst forecasts only using an unbiased methodology and our articles are not intended to be financial advice. It does not constitute a recommendation to buy or sell any stock, and does not take account of your objectives, or your financial situation. We aim to bring you long-term focused analysis driven by fundamental data. Note that our analysis may not factor in the latest price-sensitive company announcements or qualitative material. Simply Wall St has no position in any stocks mentioned.
Have feedback on this article? Concerned about the content? Get in touch with us directly. Alternatively, email editorial-team (at) simplywallst.com.
