
 Yahoo Finance
 Can Nexstar Media Group, Inc.'s (NASDAQ:NXST) ROE Continue To Surpass The Industry Average?
Many investors are still learning about the various metrics that can be useful when analysing a stock. This article is for those who would like to learn about Return On Equity (ROE). To keep the lesson grounded in practicality, we'll use ROE to better understand Nexstar Media Group, Inc. (NASDAQ:NXST).
Return on equity or ROE is an important factor to be considered by a shareholder because it tells them how effectively their capital is being reinvested. In other words, it is a profitability ratio which measures the rate of return on the capital provided by the company's shareholders.
See our latest analysis for Nexstar Media Group
How To Calculate Return On Equity?
The formula for ROE is:
Return on Equity = Net Profit (from continuing operations) ÷ Shareholders' Equity
So, based on the above formula, the ROE for Nexstar Media Group is:
34% = US$944m ÷ US$2.8b (Based on the trailing twelve months to December 2022).
The 'return' is the yearly profit. Another way to think of that is that for every $1 worth of equity, the company was able to earn $0.34 in profit.
Does Nexstar Media Group Have A Good ROE?
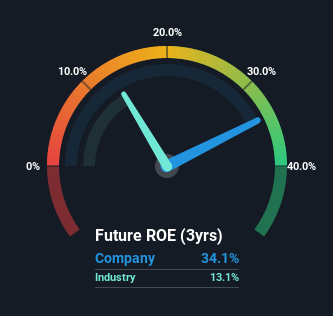
Arguably the easiest way to assess company's ROE is to compare it with the average in its industry. Importantly, this is far from a perfect measure, because companies differ significantly within the same industry classification. As you can see in the graphic below, Nexstar Media Group has a higher ROE than the average (13%) in the Media industry.
That is a good sign. With that said, a high ROE doesn't always indicate high profitability. Aside from changes in net income, a high ROE can also be the outcome of high debt relative to equity, which indicates risk. You can see the 2 risks we have identified for Nexstar Media Group by visiting our risks dashboard for free on our platform here.
The Importance Of Debt To Return On Equity
Most companies need money -- from somewhere -- to grow their profits. That cash can come from retained earnings, issuing new shares (equity), or debt. In the first two cases, the ROE will capture this use of capital to grow. In the latter case, the debt required for growth will boost returns, but will not impact the shareholders' equity. Thus the use of debt can improve ROE, albeit along with extra risk in the case of stormy weather, metaphorically speaking.
Nexstar Media Group's Debt And Its 34% ROE
Nexstar Media Group clearly uses a high amount of debt to boost returns, as it has a debt to equity ratio of 2.51. Its ROE is pretty impressive but, it would have probably been lower without the use of debt. Debt does bring extra risk, so it's only really worthwhile when a company generates some decent returns from it.
Conclusion
Return on equity is a useful indicator of the ability of a business to generate profits and return them to shareholders. In our books, the highest quality companies have high return on equity, despite low debt. If two companies have around the same level of debt to equity, and one has a higher ROE, I'd generally prefer the one with higher ROE.
Having said that, while ROE is a useful indicator of business quality, you'll have to look at a whole range of factors to determine the right price to buy a stock. It is important to consider other factors, such as future profit growth -- and how much investment is required going forward. So you might want to take a peek at this data-rich interactive graph of forecasts for the company.
Of course, you might find a fantastic investment by looking elsewhere. So take a peek at this free list of interesting companies.
Have feedback on this article? Concerned about the content? Get in touch with us directly. Alternatively, email editorial-team (at) simplywallst.com.
This article by Simply Wall St is general in nature. We provide commentary based on historical data and analyst forecasts only using an unbiased methodology and our articles are not intended to be financial advice. It does not constitute a recommendation to buy or sell any stock, and does not take account of your objectives, or your financial situation. We aim to bring you long-term focused analysis driven by fundamental data. Note that our analysis may not factor in the latest price-sensitive company announcements or qualitative material. Simply Wall St has no position in any stocks mentioned.
Join A Paid User Research Session
You’ll receive a US$30 Amazon Gift card for 1 hour of your time while helping us build better investing tools for the individual investors like yourself. Sign up here
