
 Yahoo Finance
 Newell Feels the Pinch of Soft Q2: Is it Time to Offload?

Newell Brands Inc. NWL is scoring low on investors’ interest due to its soft second-quarter 2018 performance and trimmed outlook for the year. In addition, the company has been grappling with strained margins for the last few quarters now.
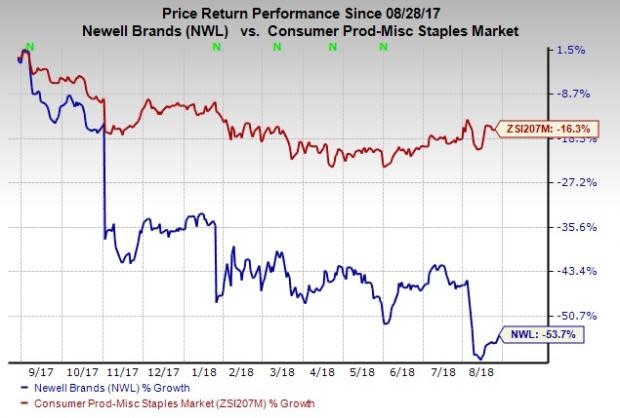
Shares of this Zacks Rank #5 (Strong Sell) company have lost nearly 16% since reporting its quarterly results on Aug 6. Moreover, the stock has plunged 53.7% in a year, much wider than the industry’s 16.3% decline. The stock’s dismal run on bourses is also well reflected in its Growth Score of F.
Additionally, analysts are pessimistic about the company’s prospects as is evident from downward estimate revisions in the last 30 days. The Zacks Consensus Estimate of 88 cents for 2018 and $1.66 for 2019 has decreased 63.6% and 38.5%, respectively. Also, the consensus mark of 28 cents for the third quarter of 2018 moved down 58.2%. Let’s delve deep.
Dismal Sales Trend
Newell has missed sales estimates in three of the trailing four quarters, including second-quarter 2018. The top line declined 12.8% due to the new revenue recognition standard and adverse impact of last year’s divestitures. The Baby division’s disrupted business along with a significant inventory destocking in the Writing division’s office superstore and distributive trade channels further hurt sales. Additionally, core sales dropped 6.2% mainly due to 14.5% decline in the Learning & Development segment (Writing and Baby) and weakness across the coolers, tents and fresh preserving businesses on the late arrival of Spring across most parts of the United States.
The company’s recently realigned three business segments — Food & Appliances, Home & Outdoor Living and Learning & Development — also witnessed a year-over-year sales decline in the second quarter.
Trimmed Guidance
Management cut down its guidance for 2018 to account for the Waddington and Rawlings business divestitures. Net sales are now projected in the band of $8.7-$9 billion, significantly down from $14.4-$14.8 billion guided earlier. Further, it anticipates normalized operating margins between 12% and 12.4% in the second half of the year. Normalized earnings per share are envisioned in the range of $2.45-$2.65, while operating cash flow is projected in the $0.9-$1.2 billion band. Earlier, Newell had projected earnings per share in the $2.65-$2.85 range, whereas operating cash flow was expected between $1.15 billion and $1.45 billion.
Even though Newell anticipates the second half of 2018 to be less severe than the first half, it still expects the retail backdrop to remain challenging.
Margin Pressures
Despite gains from cost synergies and savings, the absence of earnings related to divested businesses, commodity cost inflation, adverse product mix as well as increased advertising, promotion and e-commerce investment has been weighing on margins. Apparently, the company’s normalized gross margin contracted 50 basis points (bps) in the second quarter, with operating margin decline of 150 bps.
Is the Transformation Plan a Silver Lining?
Newell’s progress with the execution of its Transformation Plan through market share gains, point of sale growth, innovation, e-commerce improvement, and cost-saving plans remains encouraging. The key aspect of the plan is restructuring the company into a global consumer product entity, valued at more than $9 billion. This apart, the company plans to offload non-core businesses, which account for nearly 35% of its sales; utilize $10 billion after-tax proceeds from divestitures and free cash flow to lower debt, and make share repurchases as well as retain its investment grade rating and an annual dividend of 92 cents per share through 2019, targeting 30-35% payout ratio.
In line with its Accelerated Transformation Plan, the company has completed the divestiture of The Waddington Group and the Rawlings Sporting Goods Company for gross proceeds of $2.7 billion in the second quarter. Also, it has entered into an agreement with ACON Investments, L.L.C., to divest Goody Products, Inc. Moreover, Newell adds Jostens and Pure Fishing brands to the list of potential divestitures. These divestitures are expected to reshape the company’s portfolio as well as improve operational efficiency and boost shareholder value.
Bottom Line
While Newell’s Transformation Plan is on track, it remains to be seen whether this will help revive the stock’s momentum any time soon.
Meanwhile, investors may count on some better-ranked stocks in the broader Consumer Staples sector given below:
Archer Daniels Midland Company ADM delivered an average positive earnings surprise of 18.6% in the trailing four quarters. The company sports a Zacks Rank #1 (Strong Buy). You can see the complete list of today’s Zacks #1 Rank stocks here.
Calyxt, Inc. CLXT pulled off a positive earnings surprise in each of the trailing two quarters and carries a Zacks Rank #2 (Buy).
Ollie's Bargain Outlet Holdings, Inc. OLLI is a Zacks #2 Ranked stock, which has an impressive long-term earnings growth rate of 23%.
Today's Stocks from Zacks' Hottest Strategies
It's hard to believe, even for us at Zacks. But while the market gained +21.9% in 2017, our top stock-picking screens have returned +115.0%, +109.3%, +104.9%, +98.6%, and +67.1%.
And this outperformance has not just been a recent phenomenon. Over the years it has been remarkably consistent. From 2000 - 2017, the composite yearly average gain for these strategies has beaten the market more than 19X over. Maybe even more remarkable is the fact that we're willing to share their latest stocks with you without cost or obligation.
See Them Free>>
Want the latest recommendations from Zacks Investment Research? Today, you can download 7 Best Stocks for the Next 30 Days. Click to get this free report
Newell Brands Inc. (NWL) : Free Stock Analysis Report
Ollie's Bargain Outlet Holdings, Inc. (OLLI) : Free Stock Analysis Report
Archer Daniels Midland Company (ADM) : Free Stock Analysis Report
Calyxt, Inc. (CLXT) : Free Stock Analysis Report
To read this article on Zacks.com click here.
Zacks Investment Research
