
 Yahoo Finance
 NetApp (NTAP) Q2 Earnings Top Estimates, Outlook Tweaked
NetApp, Inc NTAP reported second-quarter fiscal 2023 non-GAAP earnings of $1.48 per share, which surpassed the Zacks Consensus Estimate by 10.5% and increased 16% year over year. The company anticipated non-GAAP earnings between $1.28 and $1.38 per share.
Revenues of $1.66 billion increased 6% year over year and 12% in constant currency. The company projected revenues in the range of $1.595-$1.745 billion. The upside can be attributed to the strong product revenue growth. The deceleration in revenue growth for cloud services business acted as a dampener. Revenues missed the consensus mark by 0.6%.
The company tweaked it guidance for fiscal 2023 amid ongoing global macro turmoil and significant forex volatility.
NetApp now expects fiscal 2023 revenues to grow in the range of 2-4% year-over-year and Public Cloud annualized recurring revenues (ARR) are expected to be nearly $700 million.
Earlier, NetApp had projected revenue growth of 6-8%, while Public Cloud ARR was expected to be between $780 million and $820 million.
The company now anticipates non-GAAP earnings for fiscal 2023 between $5.30 and $5.50 per share. The Zacks Consensus Estimate for fiscal 2023 earnings is pegged at $5.48 per share. Earlier, the company anticipated non-GAAP earnings for fiscal 2023 between $5.40 and $5.60 per share.
NetApp, Inc. Price, Consensus and EPS Surprise
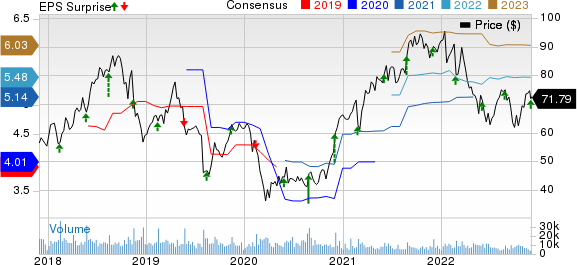
NetApp, Inc. price-consensus-eps-surprise-chart | NetApp, Inc. Quote
For fiscal 2023, NetApp expects non-GAAP gross margin to be 66-67% and non-GAAP operating margin to be 23%.
Following the announcement, shares of NetApp are down 12% in the pre-market trading on Nov 30. In the past year, shares of NetApp have lost 19.8% compared with the sub-industry’s decline of 22%.
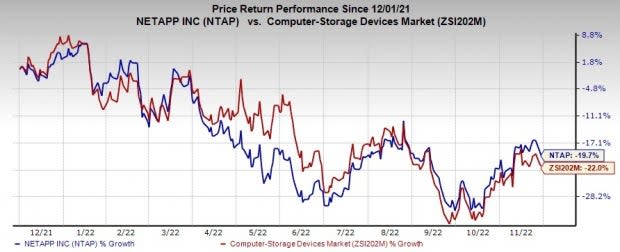
Image Source: Zacks Investment Research
Top-Line Details
The company introduced two segments for financial reporting, namely Hybrid Cloud and Public Cloud.
The Hybrid Cloud segment consists of revenues from the company’s enterprise datacenter business, which includes the product, support and professional services.
The Public Cloud segment consists of revenues from products, which are delivered as-a-service and include related support. The portfolio includes the company’s cloud automation and optimization services, storage services and cloud infrastructure monitoring services.
Revenues of the Hybrid Cloud segment were up 3% year over year to $1.52 billion. The Public Cloud segment’s revenues were up 63% from the year-ago quarter’s levels to $142 million.
Within the Hybrid Cloud segment, Product revenues (55% of segment revenues) increased 3% year over year to $837 million.
Revenues from Support Contracts (40%) totaled $607 million, up 2.9% year over year. Revenues from Professional and Other Services (5%) were $77 million, up 2.7% year over year.
Software product revenues amounted to $495 million, up 4.2% owing to the value driven by ONTAP software and data services.
Region-wise, the Americas, EMEA and the Asia Pacific contributed 54%, 32% and 14% to total revenues, respectively.
Direct and Indirect revenues contributed 23% and 77%, respectively, to total revenues.
Key Metrics
During the fiscal second quarter, the company’s All-Flash Array Business’ annualized net revenue run rate came in at $3.1 billion, up 2% year over year. Total billings increased 3% year over year to $1.6 billion. Deferred revenues came in at $4.1 billion, up 4.8% year over year.
The Public Cloud Services recorded ARR of $603 million, up 55% year over year. The Public Cloud ARR recorded dollar-based net retention rate of 140%.
Combined recurring support and Public Cloud revenues stood at $749 million, up 11% on a year-over-year basis and contributing 45% to total revenues.
Operating Details
Non-GAAP gross margin was 66.3%, contracted 200 basis points (bps) with the year-ago quarter’s levels.
The Hybrid segment’s gross margin was 66.1%, which contracted 210 bps year over year. The Public Cloud segment’s gross margin was 68.3%, which contracted 300 bps year over year.
Non-GAAP operating expenses were up 1.9% year over year to $709 million. As a percentage of net revenues, the figure contracted 180 bps on a year-over-year basis to 42.6%.
Non-GAAP operating income increased 5.1% year over year to $393 million. Non-GAAP operating margin contracted 30 bps to 23.6%.
Balance Sheet & Cash Flow
NetApp exited the quarter ending Oct 28, with $3.033 billion in cash, cash equivalents and investments compared with $3.439 billion as of Jul 29. Long-term debt was $2.387 billion, unchanged as of Jul 29.
The company generated net cash from operations of $214 million during the reported quarter compared with $281 million in the previous quarter.
Free cash flow was $137 million (free cash flow margin of 8.2%) compared with $216 million in the previous quarter (free cash flow margin of 13.6%).
The company returned $258 million to shareholders as dividend payouts ($108 million) and share repurchases ($150 million).
The company also announced a dividend of 50 cents payable on Jan 25, 2023, to shareholders of record as of the close of business on Jan 6, 2023.
Q3 Guidance
The company anticipates non-GAAP earnings to be between $1.25 and $1.35 per share. The Zacks Consensus Estimate for earnings is pegged at $1.42 per share.
Net revenues are anticipated in the range of $1.525-$1.675 billion, indicating year-over-year decline of 1% at the mid-point. The Zacks Consensus Estimate for revenues is pegged at $1.71 billion.
Zacks Rank & Stocks to Consider
NetApp currently carries a Zacks Rank #3 (Hold).
Some better-ranked stocks from the broader technology space are Arista Networks ANET, Blackbaud BLKB and Plexus PLXS. Arista Networks and Plexus currently sport a Zacks Rank #1 (Strong Buy), while Blackbaud carries a Zacks Rank #2 (Buy). You can see the complete list of today’s Zacks #1 Rank stocks here.
The Zacks Consensus Estimate for Arista Networks’ 2022 earnings is pegged at $4.37 per share, up 8.2% in the past 60 days. The long-term earnings growth rate is anticipated at 17.5%.
Arista Networks’ earnings beat the Zacks Consensus Estimate in the last four quarters, the average being 12.7%. Shares of ANET have increased 10.1% in the past year.
The Zacks Consensus Estimate for Blackbaud’s 2022 earnings is pegged at $2.59 per share, up 1.6% in the past 60 days. The long-term earnings growth rate is anticipated at 4%.
Blackbaud’s earnings beat the Zacks Consensus Estimate in the last four quarters, the average being 4.9%. Shares of BLKB have declined 18.6% in the past year.
The Zacks Consensus Estimate for Plexus’ fiscal 2023 earnings is pegged at $5.98 per share, up 8.9% in the past 60 days.
Plexus’ earnings beat the Zacks Consensus Estimate in three of the last four quarters, the average being 17.5%. Shares of PLXS have increased 22.3% in the past year.
Want the latest recommendations from Zacks Investment Research? Today, you can download 7 Best Stocks for the Next 30 Days. Click to get this free report
NetApp, Inc. (NTAP) : Free Stock Analysis Report
Plexus Corp. (PLXS) : Free Stock Analysis Report
Blackbaud, Inc. (BLKB) : Free Stock Analysis Report
Arista Networks, Inc. (ANET) : Free Stock Analysis Report
