
 Yahoo Finance
 NetApp (NTAP) Q1 Earnings & Revenues Top Estimates, Stock Up
NetApp, Inc. NTAP reported first-quarter fiscal 2021 non-GAAP earnings of 73 cents per share, which surpassed the Zacks Consensus Estimate by 82.5%. Moreover, the bottom line improved 12% from the year-ago quarter. The growth can be attributed to increase in revenue base.
Revenues of $1.303 billion increased 5% year over year, outpacing the Zacks Consensus Estimate by 13.5%. The improvement was driven by strength in File, Block and Object Software, and Public Cloud Services, which per management “outperformed the market.” Nevertheless, unfavorable foreign exchange movement limited growth by “one point.”
Region wise, the Americas, EMEA and Asia Pacific accounted for 54%, 29% and 16% of total revenues, respectively.
Direct and Indirect revenues represented 22% and 78%, respectively, of total revenues.
Stock Up on Encouraging Q2 View
NetApp is banking on improvement in adoption of Public Cloud Services offerings.
The company anticipates non-GAAP earnings for second-quarter fiscal 2021 between 66 cents and 74 cents per share. The Zacks Consensus Estimate for fiscal second-quarter earnings stands at 63 cents.
Moreover, net revenues are anticipated in the range of $1.225-$1.375 billion. The mid-point of the guided range –– $1.3 billion –– is above the consensus mark for fiscal second-quarter revenues, currently pegged at $1.23 billion.
Notably, for second-quarter fiscal 2021, NetApp expects non-GAAP gross margin in the range of 66-67% and non-GAAP operating margin to be 16%.
NetApp, Inc. Price, Consensus and EPS Surprise
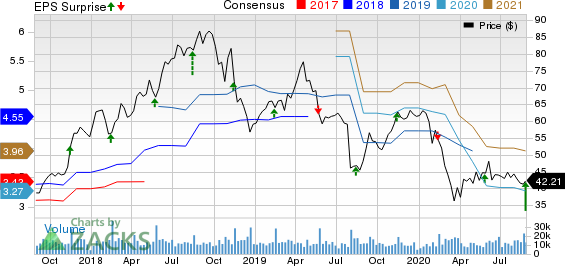
NetApp, Inc. price-consensus-eps-surprise-chart | NetApp, Inc. Quote
Following better-than-expected fiscal first quarter results and upbeat guidance, shares of NetApp were up more than 10% in the pre-market on Aug 27.
Top Line Details
Product revenues (48.1% of total revenues) decreased 3% year over year to $627 billion. The decline can be attributed to coronavirus crisis-induced macroeconomic headwinds. Nevertheless, the company witnessed gains from momentum in digital transformation and hybrid cloud projects.
In a bid to provide more visibility in to high-margined software business, the company is now breaking out product revenues into software and hardware. Revenues from products under Hardware grouping were $316 million, down 7% year over year owing to decline in uptake of spinning disk solutions. Revenues from products under Software grouping amounted to $311 million, up 2% year over year driven by solid traction witnessed by All-flash FAS products.
Software Maintenance revenues (23.1%) were $301 million, up 20.4% year over year.
Hardware Maintenance and Other Services revenues (28.8%) were $375 million, up 9.6% year over year. Revenues from Hardware Maintenance Support Contracts totaled $307 million, up 8.1% year over year. Revenues from Professional and Other Services were $68 million, up 17.2% year over year.
Key Metrics
During the fiscal first quarter, the company’s All-Flash Array Business annualized net revenue run rate came in at $2.3 billion, up 34% year over year. Moreover, all-flash revenues totaled $567 million, up 34% on a year-over-year basis.
Public Cloud Services recorded annualized recurring revenues (ARR) of $178 million, soaring 192% year over year. Recent acquisitions of Spot, Cloud Jumper and Talon contributed $44 million in ARR as of the end of the quarter. Excluding the buyouts, Public Cloud Services business grew 120% on a year-over-year basis. Moreover, the company’s partnerships with Microsoft’s MSFT Azure, Alphabet’s GOOGL Google Cloud platform, Amazon’s AMZN Amazon Web Services, are expected to aid it in expanding customer base.
Notable Acquisitions
During the reported quarter, NetApp concluded acquisition of Israel-based cloud services startup –– Spot. The deal is expected to aid NetApp to address the growing demand for efficient and cost-effective cloud infrastructure and boost customer experience.
Moreover, the company announced acquisition of CloudJumper — a cloud software company offering virtual desktop infrastructure (VDI) solutions and remote desktop services (RDS), which aids enterprises to accelerate public cloud deployments for work-from-home setup, branch offices and enterprises.
Operating Details
Non-GAAP gross margin was 68%, which expanded 80 basis points (bps) from the year-ago quarter.
On a non-GAAP basis, Product gross margin of 51.4% contracted 200 bps year over year, owing to higher NAND costs and coronavirus crisis-induced pricing trends. Meanwhile, Software Maintenance gross margin of 95% contracted 100 bps, and Hardware Maintenance and Other Services gross margin expanded 220 bps to 74.1% year over year.
Non-GAAP operating expenses climbed 3% year over year to $673 million. As a percentage of net revenues, the figure contracted 110 bps on a year-over-year basis to 51.7%.
Non-GAAP operating margin expanded 190 bps to 16.3%.
Balance Sheet & Cash Flow
NetApp exited the quarter ending Jul 31, 2020, with $3.773 billion in cash, cash equivalents and investments compared with $2.882 billion as of Apr 24, 2020. Long-term debt (including current portion) was $2.63 billion as of Jul 31, 2020, compared with $1.146 billion as of Apr 24, 2020.
The company generated net cash from operations of $240 million during the reported quarter compared with $383 million reported in the fiscal fourth quarter.
Free cash flow was $188 million compared with $359 million in the previous quarter.
Further, the company returned $107 million to shareholders through dividend payouts. The company has paused share buybacks, and did not make any share repurchases during the reported quarter, owing to coronavirus crisis-induced business uncertainty and limited visibility.
NetApp announced quarterly cash dividend of 48 cents per share to be paid out on Oct 28, 2020, to shareholders of record as of Oct 9, 2020.
Zacks Rank
NetApp currently carries a Zacks Rank #4 (Sell).
You can see the complete list of today’s Zacks #1 (Strong Buy) Rank stocks here.
These Stocks Are Poised to Soar Past the Pandemic
The COVID-19 outbreak has shifted consumer behavior dramatically, and a handful of high-tech companies have stepped up to keep America running. Right now, investors in these companies have a shot at serious profits. For example, Zoom jumped 108.5% in less than 4 months while most other stocks were sinking.
Our research shows that 5 cutting-edge stocks could skyrocket from the exponential increase in demand for “stay at home” technologies. This could be one of the biggest buying opportunities of this decade, especially for those who get in early.
See the 5 high-tech stocks now>>
Want the latest recommendations from Zacks Investment Research? Today, you can download 7 Best Stocks for the Next 30 Days. Click to get this free report
Microsoft Corporation (MSFT) : Free Stock Analysis Report
Amazon.com, Inc. (AMZN) : Free Stock Analysis Report
NetApp, Inc. (NTAP) : Free Stock Analysis Report
Alphabet Inc. (GOOGL) : Free Stock Analysis Report
To read this article on Zacks.com click here.
Zacks Investment Research
