
 Yahoo Finance
 What You Must Know About Ocean Bio-Chem, Inc.’s (NASDAQ:OBCI) Financial Strength

Ocean Bio-Chem, Inc. (NASDAQ:OBCI) is a small-cap stock with a market capitalization of US$34m. While investors primarily focus on the growth potential and competitive landscape of the small-cap companies, they end up ignoring a key aspect, which could be the biggest threat to its existence: its financial health. Why is it important? Evaluating financial health as part of your investment thesis is crucial, since poor capital management may bring about bankruptcies, which occur at a higher rate for small-caps. Here are few basic financial health checks you should consider before taking the plunge. However, given that I have not delve into the company-specifics, I suggest you dig deeper yourself into OBCI here.
How does OBCI’s operating cash flow stack up against its debt?
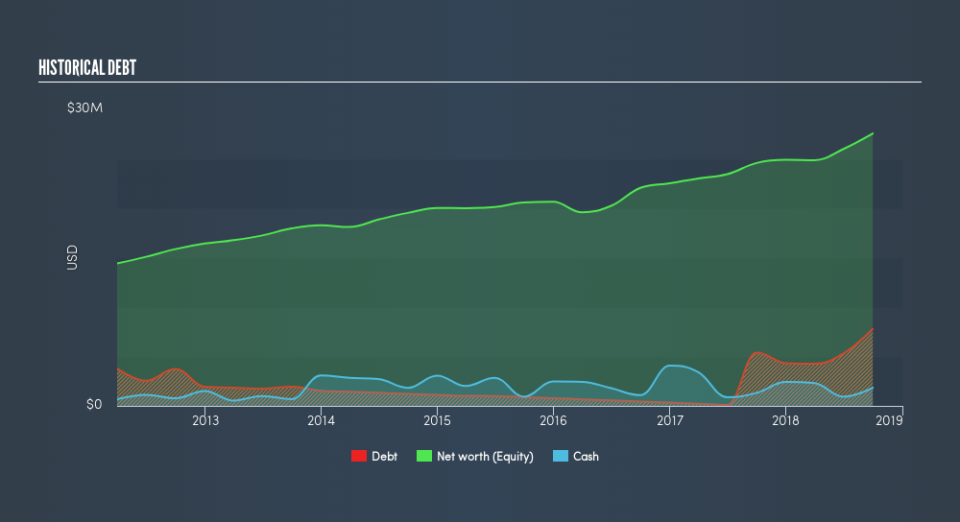
OBCI’s debt levels surged from US$5.4m to US$7.8m over the last 12 months , which includes long-term debt. With this increase in debt, OBCI’s cash and short-term investments stands at US$1.8m , ready to deploy into the business. Moreover, OBCI has produced cash from operations of US$2.0m in the last twelve months, leading to an operating cash to total debt ratio of 26%, signalling that OBCI’s debt is appropriately covered by operating cash. This ratio can also be interpreted as a measure of efficiency as an alternative to return on assets. In OBCI’s case, it is able to generate 0.26x cash from its debt capital.
Can OBCI pay its short-term liabilities?
Looking at OBCI’s US$8.1m in current liabilities, it seems that the business has been able to meet these obligations given the level of current assets of US$29m, with a current ratio of 3.53x. Having said that, many consider a ratio above 3x to be high, although this is not necessarily a bad thing.
Is OBCI’s debt level acceptable?
With a debt-to-equity ratio of 28%, OBCI’s debt level may be seen as prudent. This range is considered safe as OBCI is not taking on too much debt obligation, which may be constraining for future growth. We can test if OBCI’s debt levels are sustainable by measuring interest payments against earnings of a company. Ideally, earnings before interest and tax (EBIT) should cover net interest by at least three times. For OBCI, the ratio of 55.41x suggests that interest is comfortably covered, which means that debtors may be willing to loan the company more money, giving OBCI ample headroom to grow its debt facilities.
Next Steps:
OBCI’s high cash coverage and appropriate debt levels indicate its ability to utilise its borrowings efficiently in order to generate ample cash flow. Furthermore, the company exhibits an ability to meet its near term obligations should an adverse event occur. Keep in mind I haven’t considered other factors such as how OBCI has been performing in the past. I recommend you continue to research Ocean Bio-Chem to get a more holistic view of the stock by looking at:
Future Outlook: What are well-informed industry analysts predicting for OBCI’s future growth? Take a look at our free research report of analyst consensus for OBCI’s outlook.
Historical Performance: What has OBCI’s returns been like over the past? Go into more detail in the past track record analysis and take a look at the free visual representations of our analysis for more clarity.
Other High-Performing Stocks: Are there other stocks that provide better prospects with proven track records? Explore our free list of these great stocks here.
We aim to bring you long-term focused research analysis driven by fundamental data. Note that our analysis may not factor in the latest price-sensitive company announcements or qualitative material.
If you spot an error that warrants correction, please contact the editor at editorial-team@simplywallst.com. This article by Simply Wall St is general in nature. It does not constitute a recommendation to buy or sell any stock, and does not take account of your objectives, or your financial situation. Simply Wall St has no position in the stocks mentioned. Thank you for reading.
