
 Yahoo Finance
 What You Must Know About Cavium Inc’s (NASDAQ:CAVM) Financial Strength

Mid-caps stocks, like Cavium Inc (NASDAQ:CAVM) with a market capitalization of US$5.81b, aren’t the focus of most investors who prefer to direct their investments towards either large-cap or small-cap stocks. Surprisingly though, when accounted for risk, mid-caps have delivered better returns compared to the two other categories of stocks. Today we will look at CAVM’s financial liquidity and debt levels, which are strong indicators for whether the company can weather economic downturns or fund strategic acquisitions for future growth. Note that this information is centred entirely on financial health and is a top-level understanding, so I encourage you to look further into CAVM here. View out our latest analysis for Cavium
How much cash does CAVM generate through its operations?
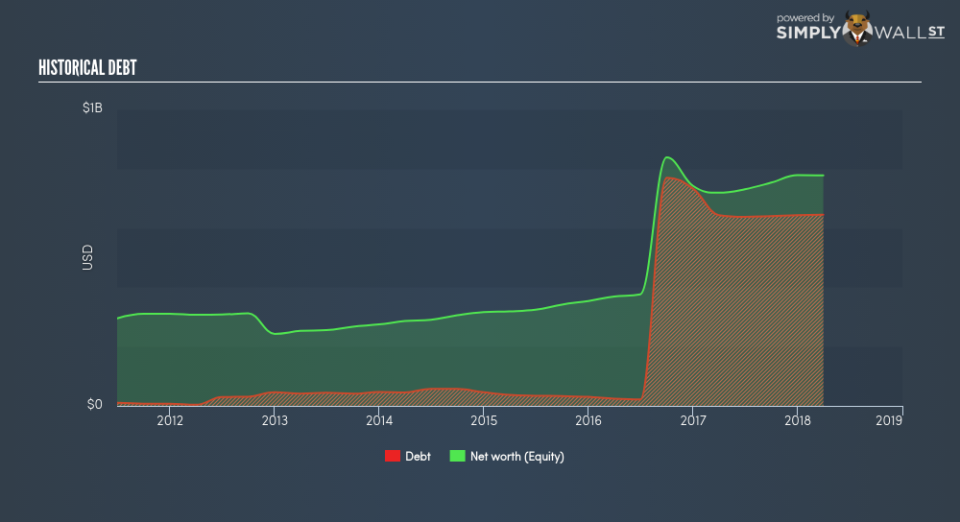
CAVM has shrunken its total debt levels in the last twelve months, from US$732.69m to US$643.04m – this includes both the current and long-term debt. With this debt payback, CAVM’s cash and short-term investments stands at US$140.50m , ready to deploy into the business. On top of this, CAVM has produced US$145.89m in operating cash flow over the same time period, leading to an operating cash to total debt ratio of 22.69%, indicating that CAVM’s operating cash is sufficient to cover its debt. This ratio can also be interpreted as a measure of efficiency for unprofitable companies since metrics such as return on asset (ROA) requires positive earnings. In CAVM’s case, it is able to generate 0.23x cash from its debt capital.
Does CAVM’s liquid assets cover its short-term commitments?
With current liabilities at US$174.01m, it seems that the business has maintained a safe level of current assets to meet its obligations, with the current ratio last standing at 2.8x. For Semiconductor companies, this ratio is within a sensible range since there is a bit of a cash buffer without leaving too much capital in a low-return environment.
Does CAVM face the risk of succumbing to its debt-load?
CAVM is a relatively highly levered company with a debt-to-equity of 82.91%. This is not unusual for mid-caps as debt tends to be a cheaper and faster source of funding for some businesses. Though, since CAVM is currently loss-making, sustainability of its current state of operations becomes a concern. Running high debt, while not yet making money, can be risky in unexpected downturns as liquidity may dry up, making it hard to operate.
Next Steps:
CAVM’s debt and cash flow levels indicate room for improvement. Its cash flow coverage of less than a quarter of debt means that operating efficiency could be an issue. However, the company exhibits proper management of current assets and upcoming liabilities. Keep in mind I haven’t considered other factors such as how CAVM has been performing in the past. I recommend you continue to research Cavium to get a better picture of the stock by looking at:
Future Outlook: What are well-informed industry analysts predicting for CAVM’s future growth? Take a look at our free research report of analyst consensus for CAVM’s outlook.
Valuation: What is CAVM worth today? Is the stock undervalued, even when its growth outlook is factored into its intrinsic value? The intrinsic value infographic in our free research report helps visualize whether CAVM is currently mispriced by the market.
Other High-Performing Stocks: Are there other stocks that provide better prospects with proven track records? Explore our free list of these great stocks here.
To help readers see pass the short term volatility of the financial market, we aim to bring you a long-term focused research analysis purely driven by fundamental data. Note that our analysis does not factor in the latest price sensitive company announcements.
The author is an independent contributor and at the time of publication had no position in the stocks mentioned.
