
 Yahoo Finance
 Mullen Group's (TSE:MTL) Returns On Capital Are Heading Higher
Finding a business that has the potential to grow substantially is not easy, but it is possible if we look at a few key financial metrics. In a perfect world, we'd like to see a company investing more capital into its business and ideally the returns earned from that capital are also increasing. This shows us that it's a compounding machine, able to continually reinvest its earnings back into the business and generate higher returns. So on that note, Mullen Group (TSE:MTL) looks quite promising in regards to its trends of return on capital.
What Is Return On Capital Employed (ROCE)?
For those that aren't sure what ROCE is, it measures the amount of pre-tax profits a company can generate from the capital employed in its business. To calculate this metric for Mullen Group, this is the formula:
Return on Capital Employed = Earnings Before Interest and Tax (EBIT) ÷ (Total Assets - Current Liabilities)
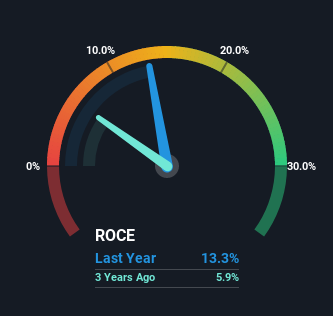
0.13 = CA$234m ÷ (CA$2.0b - CA$267m) (Based on the trailing twelve months to March 2023).
Therefore, Mullen Group has an ROCE of 13%. In absolute terms, that's a pretty normal return, and it's somewhat close to the Transportation industry average of 14%.
View our latest analysis for Mullen Group
Above you can see how the current ROCE for Mullen Group compares to its prior returns on capital, but there's only so much you can tell from the past. If you'd like to see what analysts are forecasting going forward, you should check out our free report for Mullen Group.
What The Trend Of ROCE Can Tell Us
Mullen Group's ROCE growth is quite impressive. The figures show that over the last five years, ROCE has grown 160% whilst employing roughly the same amount of capital. Basically the business is generating higher returns from the same amount of capital and that is proof that there are improvements in the company's efficiencies. On that front, things are looking good so it's worth exploring what management has said about growth plans going forward.
What We Can Learn From Mullen Group's ROCE
In summary, we're delighted to see that Mullen Group has been able to increase efficiencies and earn higher rates of return on the same amount of capital. Investors may not be impressed by the favorable underlying trends yet because over the last five years the stock has only returned 31% to shareholders. So with that in mind, we think the stock deserves further research.
On a final note, we found 3 warning signs for Mullen Group (1 is a bit unpleasant) you should be aware of.
While Mullen Group may not currently earn the highest returns, we've compiled a list of companies that currently earn more than 25% return on equity. Check out this free list here.
Have feedback on this article? Concerned about the content? Get in touch with us directly. Alternatively, email editorial-team (at) simplywallst.com.
This article by Simply Wall St is general in nature. We provide commentary based on historical data and analyst forecasts only using an unbiased methodology and our articles are not intended to be financial advice. It does not constitute a recommendation to buy or sell any stock, and does not take account of your objectives, or your financial situation. We aim to bring you long-term focused analysis driven by fundamental data. Note that our analysis may not factor in the latest price-sensitive company announcements or qualitative material. Simply Wall St has no position in any stocks mentioned.
Join A Paid User Research Session
You’ll receive a US$30 Amazon Gift card for 1 hour of your time while helping us build better investing tools for the individual investors like yourself. Sign up here
