
 Yahoo Finance
 Mullen Group Ltd.'s (TSE:MTL) Stock Has Shown Weakness Lately But Financial Prospects Look Decent: Is The Market Wrong?
With its stock down 8.9% over the past month, it is easy to disregard Mullen Group (TSE:MTL). However, the company's fundamentals look pretty decent, and long-term financials are usually aligned with future market price movements. Specifically, we decided to study Mullen Group's ROE in this article.
Return on equity or ROE is an important factor to be considered by a shareholder because it tells them how effectively their capital is being reinvested. Simply put, it is used to assess the profitability of a company in relation to its equity capital.
View our latest analysis for Mullen Group
How To Calculate Return On Equity?
Return on equity can be calculated by using the formula:
Return on Equity = Net Profit (from continuing operations) ÷ Shareholders' Equity
So, based on the above formula, the ROE for Mullen Group is:
13% = CA$117m ÷ CA$927m (Based on the trailing twelve months to December 2022).
The 'return' refers to a company's earnings over the last year. So, this means that for every CA$1 of its shareholder's investments, the company generates a profit of CA$0.13.
What Is The Relationship Between ROE And Earnings Growth?
We have already established that ROE serves as an efficient profit-generating gauge for a company's future earnings. Depending on how much of these profits the company reinvests or "retains", and how effectively it does so, we are then able to assess a company’s earnings growth potential. Generally speaking, other things being equal, firms with a high return on equity and profit retention, have a higher growth rate than firms that don’t share these attributes.
Mullen Group's Earnings Growth And 13% ROE
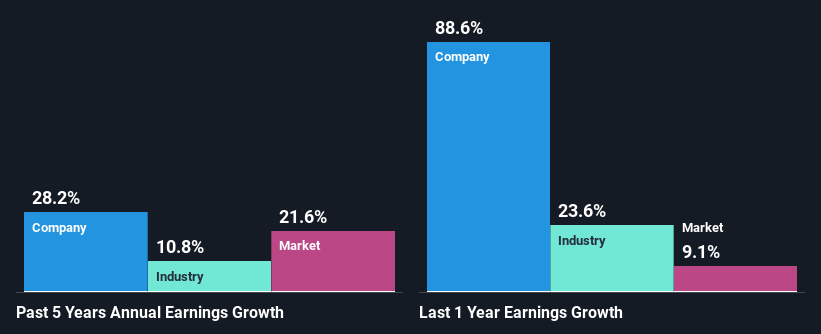
At first glance, Mullen Group seems to have a decent ROE. Yet, the fact that the company's ROE is lower than the industry average of 25% does temper our expectations. Still, we can see that Mullen Group has seen a remarkable net income growth of 28% over the past five years. We believe that there might be other aspects that are positively influencing the company's earnings growth. Such as - high earnings retention or an efficient management in place. However, not to forget, the company does have a decent ROE to begin with, just that it is lower than the industry average. So this certainly also provides some context to the high earnings growth seen by the company.
As a next step, we compared Mullen Group's net income growth with the industry, and pleasingly, we found that the growth seen by the company is higher than the average industry growth of 18%.
Earnings growth is an important metric to consider when valuing a stock. The investor should try to establish if the expected growth or decline in earnings, whichever the case may be, is priced in. By doing so, they will have an idea if the stock is headed into clear blue waters or if swampy waters await. Is MTL fairly valued? This infographic on the company's intrinsic value has everything you need to know.
Is Mullen Group Using Its Retained Earnings Effectively?
Mullen Group's significant three-year median payout ratio of 64% (where it is retaining only 36% of its income) suggests that the company has been able to achieve a high growth in earnings despite returning most of its income to shareholders.
Additionally, Mullen Group has paid dividends over a period of at least ten years which means that the company is pretty serious about sharing its profits with shareholders. Our latest analyst data shows that the future payout ratio of the company over the next three years is expected to be approximately 58%. As a result, Mullen Group's ROE is not expected to change by much either, which we inferred from the analyst estimate of 12% for future ROE.
Summary
In total, it does look like Mullen Group has some positive aspects to its business. Namely, its significant earnings growth, to which its moderate rate of return likely contributed. While the company is paying out most of its earnings as dividends, it has been able to grow its earnings in spite of it, so that's probably a good sign. Up till now, we've only made a short study of the company's growth data. So it may be worth checking this free detailed graph of Mullen Group's past earnings, as well as revenue and cash flows to get a deeper insight into the company's performance.
Have feedback on this article? Concerned about the content? Get in touch with us directly. Alternatively, email editorial-team (at) simplywallst.com.
This article by Simply Wall St is general in nature. We provide commentary based on historical data and analyst forecasts only using an unbiased methodology and our articles are not intended to be financial advice. It does not constitute a recommendation to buy or sell any stock, and does not take account of your objectives, or your financial situation. We aim to bring you long-term focused analysis driven by fundamental data. Note that our analysis may not factor in the latest price-sensitive company announcements or qualitative material. Simply Wall St has no position in any stocks mentioned.
Join A Paid User Research Session
You’ll receive a US$30 Amazon Gift card for 1 hour of your time while helping us build better investing tools for the individual investors like yourself. Sign up here
