
 Yahoo Finance
 How Much Is Orogen Royalties Inc. (CVE:OGN) Paying Its CEO?

Paddy Nicol has been the CEO of Orogen Royalties Inc. (CVE:OGN) since 2010, and this article will examine the executive's compensation with respect to the overall performance of the company. This analysis will also evaluate the appropriateness of CEO compensation when taking into account the earnings and shareholder returns of the company.
View our latest analysis for Orogen Royalties
Comparing Orogen Royalties Inc.'s CEO Compensation With the industry
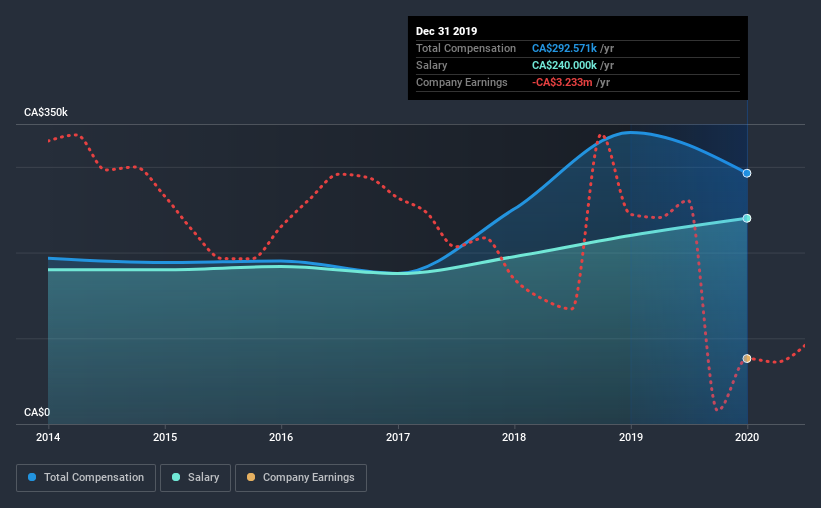
At the time of writing, our data shows that Orogen Royalties Inc. has a market capitalization of CA$97m, and reported total annual CEO compensation of CA$293k for the year to December 2019. We note that's a decrease of 14% compared to last year. In particular, the salary of CA$240.0k, makes up a huge portion of the total compensation being paid to the CEO.
In comparison with other companies in the industry with market capitalizations under CA$264m, the reported median total CEO compensation was CA$156k. This suggests that Paddy Nicol is paid more than the median for the industry.
Component | 2019 | 2018 | Proportion (2019) |
Salary | CA$240k | CA$220k | 82% |
Other | CA$53k | CA$120k | 18% |
Total Compensation | CA$293k | CA$340k | 100% |
Speaking on an industry level, nearly 83% of total compensation represents salary, while the remainder of 17% is other remuneration. Our data reveals that Orogen Royalties allocates salary more or less in line with the wider market. If total compensation veers towards salary, it suggests that the variable portion - which is generally tied to performance, is lower.
Orogen Royalties Inc.'s Growth
Over the past three years, Orogen Royalties Inc. has seen its earnings per share (EPS) grow by 4.6% per year. It saw its revenue drop 68% over the last year.
We generally like to see a little revenue growth, but it is good to see a modest EPS growth at least. It's hard to reach a conclusion about business performance right now. This may be one to watch. Although we don't have analyst forecasts, you might want to assess this data-rich visualization of earnings, revenue and cash flow.
Has Orogen Royalties Inc. Been A Good Investment?
Most shareholders would probably be pleased with Orogen Royalties Inc. for providing a total return of 84% over three years. So they may not be at all concerned if the CEO were to be paid more than is normal for companies around the same size.
To Conclude...
As previously discussed, Paddy is compensated more than what is normal for CEOs of companies of similar size, and which belong to the same industry. Importantly though, shareholder returns for the last three years have been excellent. On the other hand, EPS growth — over the same period — is not as impressive. We'd ideally want to see higher EPS growth, but CEO compensation seems to be within reason, given high shareholder returns.
We can learn a lot about a company by studying its CEO compensation trends, along with looking at other aspects of the business. In our study, we found 5 warning signs for Orogen Royalties you should be aware of, and 3 of them are concerning.
Switching gears from Orogen Royalties, if you're hunting for a pristine balance sheet and premium returns, this free list of high return, low debt companies is a great place to look.
This article by Simply Wall St is general in nature. It does not constitute a recommendation to buy or sell any stock, and does not take account of your objectives, or your financial situation. We aim to bring you long-term focused analysis driven by fundamental data. Note that our analysis may not factor in the latest price-sensitive company announcements or qualitative material. Simply Wall St has no position in any stocks mentioned.
Have feedback on this article? Concerned about the content? Get in touch with us directly. Alternatively, email editorial-team@simplywallst.com.
