
 Yahoo Finance
 How Much Did Prairie Provident Resources Inc.'s (TSE:PPR) CEO Pocket Last Year?

In 2013 Tim Granger was appointed CEO of Prairie Provident Resources Inc. (TSE:PPR). This report will, first, examine the CEO compensation levels in comparison to CEO compensation at companies of similar size. Then we'll look at a snap shot of the business growth. And finally - as a second measure of performance - we will look at the returns shareholders have received over the last few years. The aim of all this is to consider the appropriateness of CEO pay levels.
See our latest analysis for Prairie Provident Resources
How Does Tim Granger's Compensation Compare With Similar Sized Companies?
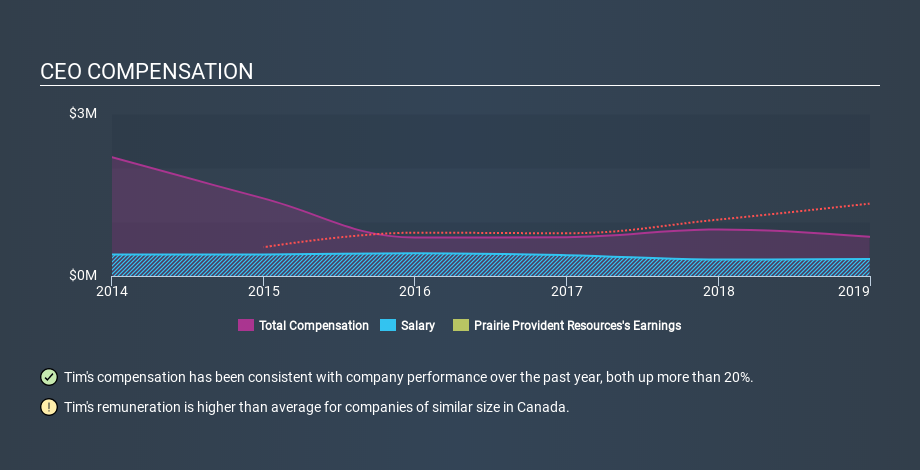
Our data indicates that Prairie Provident Resources Inc. is worth CA$6.9m, and total annual CEO compensation was reported as CA$725k for the year to December 2018. While this analysis focuses on total compensation, it's worth noting the salary is lower, valued at CA$314k. We took a group of companies with market capitalizations below CA$265m, and calculated the median CEO total compensation to be CA$210k.
It would therefore appear that Prairie Provident Resources Inc. pays Tim Granger more than the median CEO remuneration at companies of a similar size, in the same market. However, this fact alone doesn't mean the remuneration is too high. A closer look at the performance of the underlying business will give us a better idea about whether the pay is particularly generous.
You can see, below, how CEO compensation at Prairie Provident Resources has changed over time.
Is Prairie Provident Resources Inc. Growing?
Prairie Provident Resources Inc. has increased its earnings per share (EPS) by an average of 28% a year, over the last three years (using a line of best fit). The trailing twelve months of revenue was pretty much the same as the prior period.
This demonstrates that the company has been improving recently. A good result. It's also good to see modest revenue growth, suggesting the underlying business is healthy. Although we don't have analyst forecasts you could get a better understanding of its growth by checking out this more detailed historical graph of earnings, revenue and cash flow.
Has Prairie Provident Resources Inc. Been A Good Investment?
Given the total loss of 94% over three years, many shareholders in Prairie Provident Resources Inc. are probably rather dissatisfied, to say the least. It therefore might be upsetting for shareholders if the CEO were paid generously.
In Summary...
We compared the total CEO remuneration paid by Prairie Provident Resources Inc., and compared it to remuneration at a group of similar sized companies. We found that it pays well over the median amount paid in the benchmark group.
Importantly, though, the company has impressed with its earnings per share growth, over three years. On the other hand returns to investors over the same period have probably disappointed many. While EPS is positive, we'd say shareholders would want better returns before the CEO is paid much more. So you may want to check if insiders are buying Prairie Provident Resources shares with their own money (free access).
Of course, you might find a fantastic investment by looking elsewhere. So take a peek at this free list of interesting companies.
If you spot an error that warrants correction, please contact the editor at editorial-team@simplywallst.com. This article by Simply Wall St is general in nature. It does not constitute a recommendation to buy or sell any stock, and does not take account of your objectives, or your financial situation. Simply Wall St has no position in the stocks mentioned.
We aim to bring you long-term focused research analysis driven by fundamental data. Note that our analysis may not factor in the latest price-sensitive company announcements or qualitative material. Thank you for reading.
