
 Yahoo Finance
 How Much Did Nu Skin Enterprises'(NYSE:NUS) Shareholders Earn From Share Price Movements Over The Last Three Years?

Nu Skin Enterprises, Inc. (NYSE:NUS) shareholders will doubtless be very grateful to see the share price up 31% in the last quarter. But that cannot eclipse the less-than-impressive returns over the last three years. Truth be told the share price declined 26% in three years and that return, Dear Reader, falls short of what you could have got from passive investing with an index fund.
See our latest analysis for Nu Skin Enterprises
While the efficient markets hypothesis continues to be taught by some, it has been proven that markets are over-reactive dynamic systems, and investors are not always rational. By comparing earnings per share (EPS) and share price changes over time, we can get a feel for how investor attitudes to a company have morphed over time.
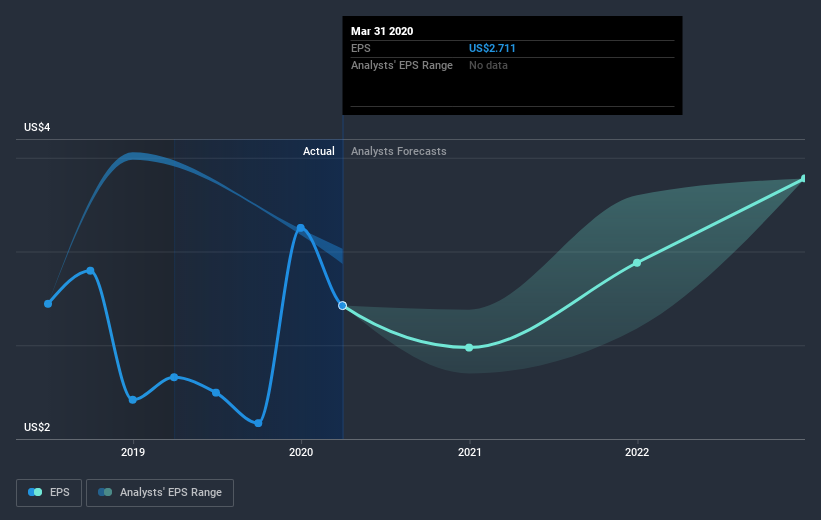
Nu Skin Enterprises saw its EPS decline at a compound rate of 4.0% per year, over the last three years. This reduction in EPS is slower than the 9.5% annual reduction in the share price. So it seems the market was too confident about the business, in the past.
The graphic below depicts how EPS has changed over time (unveil the exact values by clicking on the image).
We like that insiders have been buying shares in the last twelve months. Even so, future earnings will be far more important to whether current shareholders make money. This free interactive report on Nu Skin Enterprises' earnings, revenue and cash flow is a great place to start, if you want to investigate the stock further.
What About Dividends?
When looking at investment returns, it is important to consider the difference between total shareholder return (TSR) and share price return. Whereas the share price return only reflects the change in the share price, the TSR includes the value of dividends (assuming they were reinvested) and the benefit of any discounted capital raising or spin-off. So for companies that pay a generous dividend, the TSR is often a lot higher than the share price return. We note that for Nu Skin Enterprises the TSR over the last 3 years was -19%, which is better than the share price return mentioned above. This is largely a result of its dividend payments!
A Different Perspective
Nu Skin Enterprises provided a TSR of 19% over the year (including dividends). That's fairly close to the broader market return. Most would be happy with a gain, and it helps that the year's return is actually better than the average return over five years, which was 3.6%. Even if the share price growth slows down from here, there's a good chance that this is business worth watching in the long term. While it is well worth considering the different impacts that market conditions can have on the share price, there are other factors that are even more important. For instance, we've identified 3 warning signs for Nu Skin Enterprises that you should be aware of.
Nu Skin Enterprises is not the only stock insiders are buying. So take a peek at this free list of growing companies with insider buying.
Please note, the market returns quoted in this article reflect the market weighted average returns of stocks that currently trade on US exchanges.
This article by Simply Wall St is general in nature. It does not constitute a recommendation to buy or sell any stock, and does not take account of your objectives, or your financial situation. We aim to bring you long-term focused analysis driven by fundamental data. Note that our analysis may not factor in the latest price-sensitive company announcements or qualitative material. Simply Wall St has no position in any stocks mentioned.
Have feedback on this article? Concerned about the content? Get in touch with us directly. Alternatively, email editorial-team@simplywallst.com.
