
 Yahoo Finance
 How Much Did Altria Group's (NYSE:MO) Shareholders Earn On Their Investment Over The Last Five Years?
Ideally, your overall portfolio should beat the market average. But the main game is to find enough winners to more than offset the losers So we wouldn't blame long term Altria Group, Inc. (NYSE:MO) shareholders for doubting their decision to hold, with the stock down 28% over a half decade. Unhappily, the share price slid 5.1% in the last week.
See our latest analysis for Altria Group
While the efficient markets hypothesis continues to be taught by some, it has been proven that markets are over-reactive dynamic systems, and investors are not always rational. By comparing earnings per share (EPS) and share price changes over time, we can get a feel for how investor attitudes to a company have morphed over time.
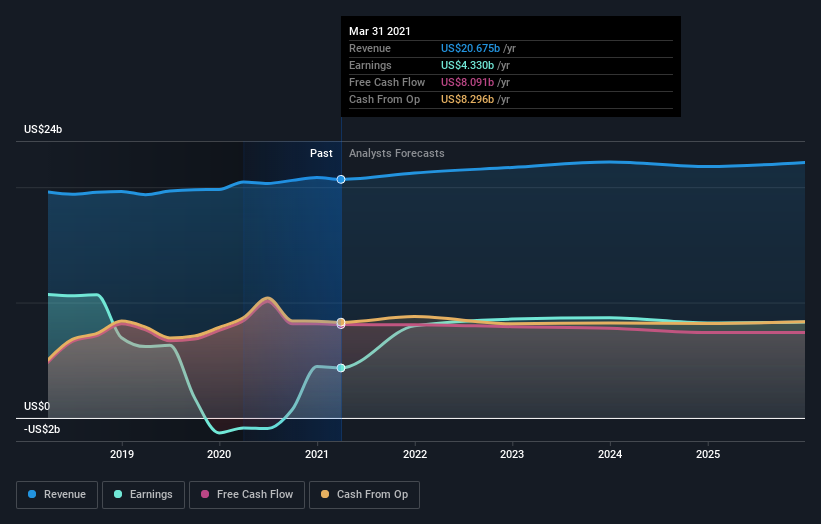
Altria Group became profitable within the last five years. Most would consider that to be a good thing, so it's counter-intuitive to see the share price declining. Other metrics may better explain the share price move.
We note that the dividend has remained healthy, so that wouldn't really explain the share price drop. It's not immediately clear to us why the stock price is down but further research might provide some answers.
You can see below how earnings and revenue have changed over time (discover the exact values by clicking on the image).
Altria Group is a well known stock, with plenty of analyst coverage, suggesting some visibility into future growth. You can see what analysts are predicting for Altria Group in this interactive graph of future profit estimates.
What About Dividends?
When looking at investment returns, it is important to consider the difference between total shareholder return (TSR) and share price return. The TSR is a return calculation that accounts for the value of cash dividends (assuming that any dividend received was reinvested) and the calculated value of any discounted capital raisings and spin-offs. Arguably, the TSR gives a more comprehensive picture of the return generated by a stock. As it happens, Altria Group's TSR for the last 5 years was -3.8%, which exceeds the share price return mentioned earlier. And there's no prize for guessing that the dividend payments largely explain the divergence!
A Different Perspective
Altria Group provided a TSR of 25% over the last twelve months. Unfortunately this falls short of the market return. On the bright side, that's still a gain, and it is certainly better than the yearly loss of about 0.8% endured over half a decade. It could well be that the business is stabilizing. I find it very interesting to look at share price over the long term as a proxy for business performance. But to truly gain insight, we need to consider other information, too. Consider risks, for instance. Every company has them, and we've spotted 3 warning signs for Altria Group you should know about.
We will like Altria Group better if we see some big insider buys. While we wait, check out this free list of growing companies with considerable, recent, insider buying.
Please note, the market returns quoted in this article reflect the market weighted average returns of stocks that currently trade on US exchanges.
This article by Simply Wall St is general in nature. It does not constitute a recommendation to buy or sell any stock, and does not take account of your objectives, or your financial situation. We aim to bring you long-term focused analysis driven by fundamental data. Note that our analysis may not factor in the latest price-sensitive company announcements or qualitative material. Simply Wall St has no position in any stocks mentioned.
Have feedback on this article? Concerned about the content? Get in touch with us directly. Alternatively, email editorial-team (at) simplywallst.com.
