
 Yahoo Finance
 Monro's (NASDAQ:MNRO) earnings growth rate lags the 30% return delivered to shareholders
A diverse portfolio of stocks will always have winners and losers. But if you're going to beat the market overall, you need to have individual stocks that outperform. Monro, Inc. (NASDAQ:MNRO) has done well over the last year, with the stock price up 28% beating the market return of 26% (not including dividends). In contrast, the longer term returns are negative, since the share price is 15% lower than it was three years ago.
While the stock has fallen 7.3% this week, it's worth focusing on the longer term and seeing if the stocks historical returns have been driven by the underlying fundamentals.
View our latest analysis for Monro
To quote Buffett, 'Ships will sail around the world but the Flat Earth Society will flourish. There will continue to be wide discrepancies between price and value in the marketplace...' One imperfect but simple way to consider how the market perception of a company has shifted is to compare the change in the earnings per share (EPS) with the share price movement.
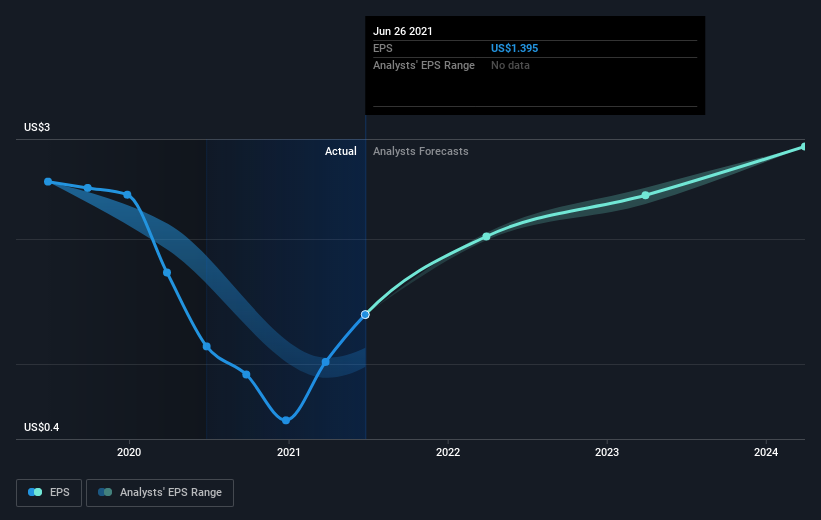
Monro was able to grow EPS by 22% in the last twelve months. The share price gain of 28% certainly outpaced the EPS growth. This indicates that the market is now more optimistic about the stock.
You can see below how EPS has changed over time (discover the exact values by clicking on the image).
It's probably worth noting we've seen significant insider buying in the last quarter, which we consider a positive. That said, we think earnings and revenue growth trends are even more important factors to consider. Dive deeper into the earnings by checking this interactive graph of Monro's earnings, revenue and cash flow.
What About Dividends?
As well as measuring the share price return, investors should also consider the total shareholder return (TSR). The TSR is a return calculation that accounts for the value of cash dividends (assuming that any dividend received was reinvested) and the calculated value of any discounted capital raisings and spin-offs. Arguably, the TSR gives a more comprehensive picture of the return generated by a stock. In the case of Monro, it has a TSR of 30% for the last 1 year. That exceeds its share price return that we previously mentioned. This is largely a result of its dividend payments!
A Different Perspective
Monro shareholders have received returns of 30% over twelve months (even including dividends), which isn't far from the general market return. To take a positive view, the gain is pleasing, and it sure beats annualized TSR loss of 0.6%, which was endured over half a decade. While 'turnarounds seldom turn' there are green shoots for Monro. If you want to research this stock further, the data on insider buying is an obvious place to start. You can click here to see who has been buying shares - and the price they paid.
Monro is not the only stock insiders are buying. So take a peek at this free list of growing companies with insider buying.
Please note, the market returns quoted in this article reflect the market weighted average returns of stocks that currently trade on US exchanges.
This article by Simply Wall St is general in nature. We provide commentary based on historical data and analyst forecasts only using an unbiased methodology and our articles are not intended to be financial advice. It does not constitute a recommendation to buy or sell any stock, and does not take account of your objectives, or your financial situation. We aim to bring you long-term focused analysis driven by fundamental data. Note that our analysis may not factor in the latest price-sensitive company announcements or qualitative material. Simply Wall St has no position in any stocks mentioned.
Have feedback on this article? Concerned about the content? Get in touch with us directly. Alternatively, email editorial-team (at) simplywallst.com.
