
 Yahoo Finance
 Mid-America Apartment (MAA) Q1 FFO & Revenues Top, '23 View Up

Mid-America Apartment Communities, Inc. MAA, commonly referred to as MAA, reported first-quarter 2023 core funds from operations (FFO) per share of $2.28, surpassing the Zacks Consensus Estimate of $2.25. Moreover, the reported figure climbed 15.7% year over year.
This residential REIT’s quarterly results were driven by an increase in the average effective rent per unit for the same-store portfolio. MAA also raised its outlook for 2023 core FFO per share.
Rental and other property revenues were $529.03 million, outpacing the Zacks Consensus Estimate of $525.1 million. The reported figure was 11.1% higher than the previous-year quarter’s $476.1 million.
Per Eric Bolton, the chairman and chief executive officer of MAA, “Results for the first quarter were ahead of expectations as the demand for apartment housing across our portfolio remains strong. Our portfolio is well positioned as we head into the busy summer leasing season.”
Quarter in Detail
The same-store portfolio’s revenues grew 11% on a year-over-year basis due to a rise of 12.6% in the average effective rent per unit.
However, the average physical occupancy for the same-store portfolio in the first quarter declined 40 basis points year over year to 95.5%. The reported figure met our estimate of 95.5%. The resident turnover for the same period was 46%. Same-store portfolio operating expenses flared up 8.3%.
On a blended basis, effective during the first quarter, the same-store portfolio leasing pricing of both new and renewing leases rose 3.9% from the prior lease. An 8.6% increase in renewing leases supported this growth, partially offset by a 0.5% fall for leases to new move-in residents. This mirrored usually slower seasonal leasing volumes.
Moreover, the same-store net operating income (NOI) reflected year-over-year growth of 12.5%.
Balance Sheet Position
MAA exited first-quarter 2023 with cash and cash equivalents of $142.4 million, significantly up from $38.7 million recorded as of Dec 31, 2022.
As of Mar 31, 2023, MAA had a strong balance sheet with $1.4 billion in combined cash and capacity available under its unsecured revolving credit facility. Also, it had a historically low Net Debt/Adjusted EBITDAre ratio of 3.5.
As of the same date, the total debt outstanding was $4.4 billion. Its total debt average years to maturity was 7.7 years. As of Mar 31, 2023, unencumbered NOI was 95.1% of the total NOI.
Furthermore, during the reported quarter, MAA’s long-term debt rating was upgraded by Moody's Investors Service to A3 with a Stable outlook.
Portfolio Activity
As of the end of first-quarter 2023, MAA redeveloped 1,328 apartment homes, while Smart Home technology installations completed were in 18,254 units.
As of Mar 31, 2023, MAA had six communities under development, with a total projected cost of $731.5 million and an estimated $388.9 million remaining to be funded. The projected average stabilized NOI yield is 5.6% for the same.
During the first quarter, MAA closed the buyout of a six-acre land parcel in Orlando, FL, for around $12 million. The purchased land parcel will be utilized for future development.
MAA also disposed of land parcels in the Gulf Shores of Alabama market, totaling 21 acres.
2023 Guidance Up
MAA raised its guidance for 2023 core FFO per share.
This residential REIT now estimates the same in the range of $8.93-$9.29, with a midpoint of $9.11. The earlier projected range was $8.88-$9.28, with a midpoint of $9.08. The Zacks Consensus Estimate for the same is currently pegged at $9.12, which lies within the guided range.
For the full year, management maintained its outlook for same-store property revenue growth at 5.25-7.25% and operating expense growth between 5.15% and 7.15%. As a result, the same-store NOI growth was retained in the range of 5.30-7.30%. Average physical occupancy for the same-store portfolio remains unchanged in the range of 95.6-96.0%.
MAA projects second-quarter 2023 core FFO per share in the band of $2.18-$2.34, with $2.26 being the midpoint. The Zacks Consensus Estimate for the same is currently pegged at $2.26.
MAA currently carries a Zacks Rank #3 (Hold). You can see the complete list of today’s Zacks #1 Rank (Strong Buy) stocks here.
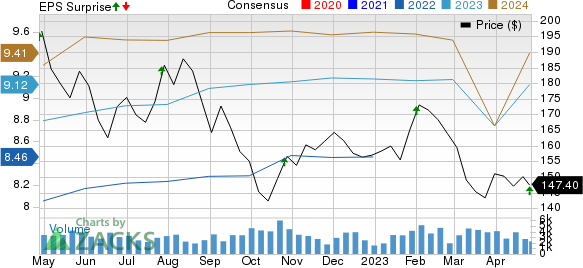
Mid-America Apartment Communities, Inc. Price, Consensus and EPS Surprise
Mid-America Apartment Communities, Inc. price-consensus-eps-surprise-chart | Mid-America Apartment Communities, Inc. Quote
Performance of Other Residential REITs
AvalonBay Communities, Inc. AVB reported first-quarter 2023 core FFO per share of $2.57, beating the Zacks Consensus Estimate of $2.54 and our estimate of $2.51. Moreover, the figure climbed 13.7% from the prior-year quarter’s tally.
The quarterly results reflect a year-over-year increase in same-store residential rental revenues driven by solid lease rate growth. The same-store average rental revenue per occupied home and occupancy improved sequentially. AVB also raised its core FFO per share outlook for 2023.
Equity Residential’s EQR first-quarter 2023 normalized FFO per share of 87 cents increased 13% year over year but narrowly missed the Zacks Consensus Estimate of 88 cents.
Results reflected continued healthy demand and lower-than-anticipated bad debt. EQR also noted that it experienced better payment and move-out activity related to delinquent residents than assumed in its February 2023 guidance.
However, higher expenses due to repair and maintenance work resulting from severe California rain storms, coupled with increased property-related legal and administrative expenditures, acted as a dampener. Also, there was a contraction in physical occupancy.
UDR Inc. UDR reported first-quarter 2023 FFO as adjusted (FFOA) per share of 60 cents, missing the Zacks Consensus Estimate by a whisker.
Revenues from rental income of $398.3 million, too, lagged the Zacks Consensus Estimate of $404.5 million.
Quarterly results reflect lower-than-anticipated revenues. A fall in occupancy and higher same-store expenses act as dampeners. Nonetheless, UDR benefited from a rise in blended lease rates and past accretive external growth investments. It also reaffirmed its 2023 outlook.
On a year-over-year basis, FFOA per share and revenues from rental income climbed 9.1% and 11.8%, respectively.
Note: Anything related to earnings presented in this write-up represent FFO — a widely used metric to gauge the performance of REITs.
Want the latest recommendations from Zacks Investment Research? Today, you can download 7 Best Stocks for the Next 30 Days. Click to get this free report
AvalonBay Communities, Inc. (AVB) : Free Stock Analysis Report
Equity Residential (EQR) : Free Stock Analysis Report
United Dominion Realty Trust, Inc. (UDR) : Free Stock Analysis Report
Mid-America Apartment Communities, Inc. (MAA) : Free Stock Analysis Report
