
 Yahoo Finance
 Do You Like Microsoft Corporation (NASDAQ:MSFT) At This P/E Ratio?

Want to participate in a short research study? Help shape the future of investing tools and you could win a $250 gift card!
This article is written for those who want to get better at using price to earnings ratios (P/E ratios). We'll show how you can use Microsoft Corporation's (NASDAQ:MSFT) P/E ratio to inform your assessment of the investment opportunity. Looking at earnings over the last twelve months, Microsoft has a P/E ratio of 30.11. That corresponds to an earnings yield of approximately 3.3%.
See our latest analysis for Microsoft
How Do I Calculate Microsoft's Price To Earnings Ratio?
The formula for price to earnings is:
Price to Earnings Ratio = Price per Share ÷ Earnings per Share (EPS)
Or for Microsoft:
P/E of 30.11 = $136.95 ÷ $4.55 (Based on the trailing twelve months to March 2019.)
Is A High P/E Ratio Good?
The higher the P/E ratio, the higher the price tag of a business, relative to its trailing earnings. That isn't a good or a bad thing on its own, but a high P/E means that buyers have a higher opinion of the business's prospects, relative to stocks with a lower P/E.
How Growth Rates Impact P/E Ratios
Probably the most important factor in determining what P/E a company trades on is the earnings growth. When earnings grow, the 'E' increases, over time. That means even if the current P/E is high, it will reduce over time if the share price stays flat. And as that P/E ratio drops, the company will look cheap, unless its share price increases.
In the last year, Microsoft grew EPS like Taylor Swift grew her fan base back in 2010; the 122% gain was both fast and well deserved. And earnings per share have improved by 51% annually, over the last three years. So we'd absolutely expect it to have a relatively high P/E ratio.
How Does Microsoft's P/E Ratio Compare To Its Peers?
We can get an indication of market expectations by looking at the P/E ratio. If you look at the image below, you can see Microsoft has a lower P/E than the average (51.6) in the software industry classification.
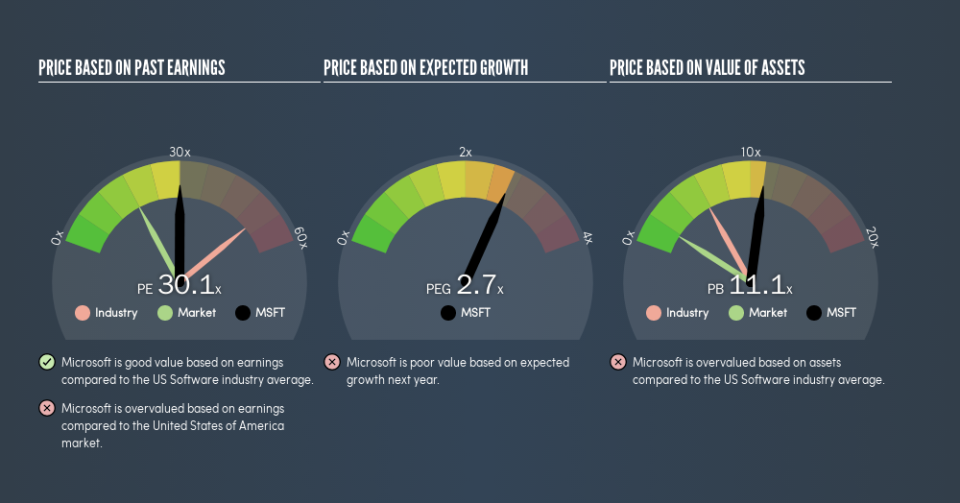
Its relatively low P/E ratio indicates that Microsoft shareholders think it will struggle to do as well as other companies in its industry classification. While current expectations are low, the stock could be undervalued if the situation is better than the market assumes. If you consider the stock interesting, further research is recommended. For example, I often monitor director buying and selling.
Remember: P/E Ratios Don't Consider The Balance Sheet
It's important to note that the P/E ratio considers the market capitalization, not the enterprise value. Thus, the metric does not reflect cash or debt held by the company. In theory, a company can lower its future P/E ratio by using cash or debt to invest in growth.
While growth expenditure doesn't always pay off, the point is that it is a good option to have; but one that the P/E ratio ignores.
So What Does Microsoft's Balance Sheet Tell Us?
Since Microsoft holds net cash of US$53b, it can spend on growth, justifying a higher P/E ratio than otherwise.
The Bottom Line On Microsoft's P/E Ratio
Microsoft trades on a P/E ratio of 30.1, which is above the US market average of 18. Its net cash position is the cherry on top of its superb EPS growth. So based on this analysis we'd expect Microsoft to have a high P/E ratio.
Investors should be looking to buy stocks that the market is wrong about. As value investor Benjamin Graham famously said, 'In the short run, the market is a voting machine but in the long run, it is a weighing machine.' So this free report on the analyst consensus forecasts could help you make a master move on this stock.
Of course you might be able to find a better stock than Microsoft. So you may wish to see this free collection of other companies that have grown earnings strongly.
We aim to bring you long-term focused research analysis driven by fundamental data. Note that our analysis may not factor in the latest price-sensitive company announcements or qualitative material.
If you spot an error that warrants correction, please contact the editor at editorial-team@simplywallst.com. This article by Simply Wall St is general in nature. It does not constitute a recommendation to buy or sell any stock, and does not take account of your objectives, or your financial situation. Simply Wall St has no position in the stocks mentioned. Thank you for reading.
