
 Yahoo Finance
 Is Methanex Corporation's (TSE:MX) CEO Pay Justified?

John Floren has been the CEO of Methanex Corporation (TSE:MX) since 2013. This report will, first, examine the CEO compensation levels in comparison to CEO compensation at companies of similar size. After that, we will consider the growth in the business. Third, we'll reflect on the total return to shareholders over three years, as a second measure of business performance. The aim of all this is to consider the appropriateness of CEO pay levels.
Check out our latest analysis for Methanex
How Does John Floren's Compensation Compare With Similar Sized Companies?
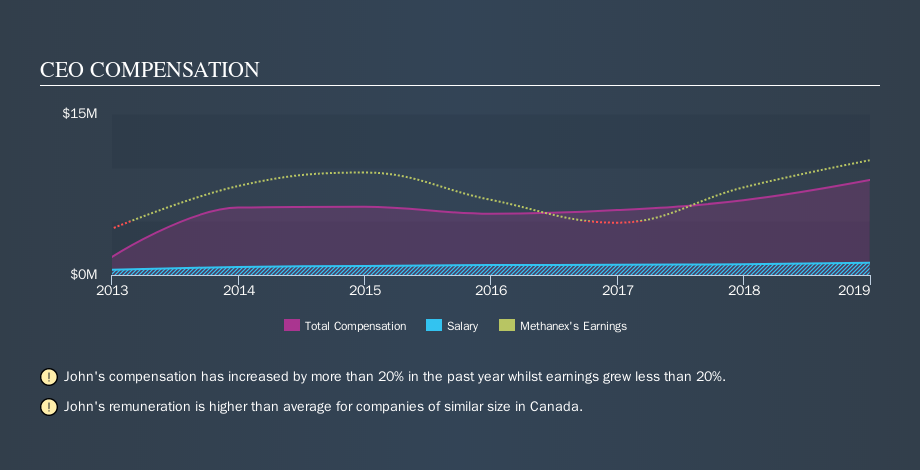
Our data indicates that Methanex Corporation is worth CA$3.7b, and total annual CEO compensation was reported as US$8.9m for the year to December 2018. We think total compensation is more important but we note that the CEO salary is lower, at US$1.1m. Importantly, there may be performance hurdles relating to the non-salary component of the total compensation. We examined companies with market caps from CA$2.6b to CA$8.5b, and discovered that the median CEO total compensation of that group was CA$3.8m.
It would therefore appear that Methanex Corporation pays John Floren more than the median CEO remuneration at companies of a similar size, in the same market. However, this fact alone doesn't mean the remuneration is too high. We can get a better idea of how generous the pay is by looking at the performance of the underlying business.
You can see, below, how CEO compensation at Methanex has changed over time.
Is Methanex Corporation Growing?
Over the last three years Methanex Corporation has grown its earnings per share (EPS) by an average of 66% per year (using a line of best fit). Revenue was pretty flat on last year.
This demonstrates that the company has been improving recently. A good result. It's nice to see a little revenue growth, as this is consistent with healthy business conditions. It could be important to check this free visual depiction of what analysts expect for the future.
Has Methanex Corporation Been A Good Investment?
With a total shareholder return of 7.1% over three years, Methanex Corporation has done okay by shareholders. But they probably wouldn't be so happy as to think the CEO should be paid more than is normal, for companies around this size.
In Summary...
We compared total CEO remuneration at Methanex Corporation with the amount paid at companies with a similar market capitalization. We found that it pays well over the median amount paid in the benchmark group.
However we must not forget that the EPS growth has been very strong over three years. Looking at the same time period, we think that the shareholder returns are respectable. You might wish to research management further, but on this analysis, considering the EPS growth, we wouldn't call the CEO pay problematic. Whatever your view on compensation, you might want to check if insiders are buying or selling Methanex shares (free trial).
Of course, you might find a fantastic investment by looking elsewhere. So take a peek at this free list of interesting companies.
We aim to bring you long-term focused research analysis driven by fundamental data. Note that our analysis may not factor in the latest price-sensitive company announcements or qualitative material.
If you spot an error that warrants correction, please contact the editor at editorial-team@simplywallst.com. This article by Simply Wall St is general in nature. It does not constitute a recommendation to buy or sell any stock, and does not take account of your objectives, or your financial situation. Simply Wall St has no position in the stocks mentioned. Thank you for reading.
