
 Yahoo Finance
 Mene (CVE:MENE) Might Have The Makings Of A Multi-Bagger
Finding a business that has the potential to grow substantially is not easy, but it is possible if we look at a few key financial metrics. Firstly, we'll want to see a proven return on capital employed (ROCE) that is increasing, and secondly, an expanding base of capital employed. Put simply, these types of businesses are compounding machines, meaning they are continually reinvesting their earnings at ever-higher rates of return. So on that note, Mene (CVE:MENE) looks quite promising in regards to its trends of return on capital.
Return On Capital Employed (ROCE): What is it?
If you haven't worked with ROCE before, it measures the 'return' (pre-tax profit) a company generates from capital employed in its business. Analysts use this formula to calculate it for Mene:
Return on Capital Employed = Earnings Before Interest and Tax (EBIT) ÷ (Total Assets - Current Liabilities)
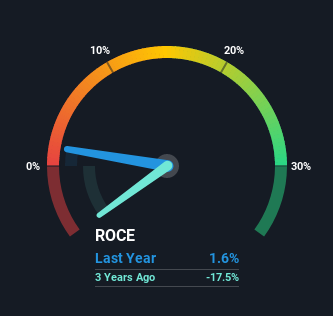
0.016 = CA$273k ÷ (CA$28m - CA$11m) (Based on the trailing twelve months to June 2021).
Thus, Mene has an ROCE of 1.6%. In absolute terms, that's a low return and it also under-performs the Luxury industry average of 12%.
Check out our latest analysis for Mene
While the past is not representative of the future, it can be helpful to know how a company has performed historically, which is why we have this chart above. If you'd like to look at how Mene has performed in the past in other metrics, you can view this free graph of past earnings, revenue and cash flow.
So How Is Mene's ROCE Trending?
Like most people, we're pleased that Mene is now generating some pretax earnings. Historically the company was generating losses but as we can see from the latest figures referenced above, they're now earning 1.6% on their capital employed. At first glance, it seems the business is getting more proficient at generating returns, because over the same period, the amount of capital employed has reduced by 28%. The reduction could indicate that the company is selling some assets, and considering returns are up, they appear to be selling the right ones.
On a side note, we noticed that the improvement in ROCE appears to be partly fueled by an increase in current liabilities. Essentially the business now has suppliers or short-term creditors funding about 39% of its operations, which isn't ideal. It's worth keeping an eye on this because as the percentage of current liabilities to total assets increases, some aspects of risk also increase.
In Conclusion...
In a nutshell, we're pleased to see that Mene has been able to generate higher returns from less capital. And investors seem to expect more of this going forward, since the stock has rewarded shareholders with a 15% return over the last year. In light of that, we think it's worth looking further into this stock because if Mene can keep these trends up, it could have a bright future ahead.
One final note, you should learn about the 5 warning signs we've spotted with Mene (including 2 which are significant) .
While Mene isn't earning the highest return, check out this free list of companies that are earning high returns on equity with solid balance sheets.
This article by Simply Wall St is general in nature. We provide commentary based on historical data and analyst forecasts only using an unbiased methodology and our articles are not intended to be financial advice. It does not constitute a recommendation to buy or sell any stock, and does not take account of your objectives, or your financial situation. We aim to bring you long-term focused analysis driven by fundamental data. Note that our analysis may not factor in the latest price-sensitive company announcements or qualitative material. Simply Wall St has no position in any stocks mentioned.
Have feedback on this article? Concerned about the content? Get in touch with us directly. Alternatively, email editorial-team (at) simplywallst.com.
