
 Yahoo Finance
 Maxim Power (TSE:MXG) Is Doing The Right Things To Multiply Its Share Price
There are a few key trends to look for if we want to identify the next multi-bagger. In a perfect world, we'd like to see a company investing more capital into its business and ideally the returns earned from that capital are also increasing. Put simply, these types of businesses are compounding machines, meaning they are continually reinvesting their earnings at ever-higher rates of return. Speaking of which, we noticed some great changes in Maxim Power's (TSE:MXG) returns on capital, so let's have a look.
Understanding Return On Capital Employed (ROCE)
If you haven't worked with ROCE before, it measures the 'return' (pre-tax profit) a company generates from capital employed in its business. The formula for this calculation on Maxim Power is:
Return on Capital Employed = Earnings Before Interest and Tax (EBIT) ÷ (Total Assets - Current Liabilities)
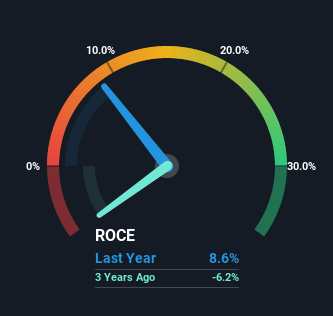
0.086 = CA$30m ÷ (CA$365m - CA$22m) (Based on the trailing twelve months to March 2022).
Thus, Maxim Power has an ROCE of 8.6%. In absolute terms, that's a low return, but it's much better than the Renewable Energy industry average of 4.5%.
See our latest analysis for Maxim Power
While the past is not representative of the future, it can be helpful to know how a company has performed historically, which is why we have this chart above. If you'd like to look at how Maxim Power has performed in the past in other metrics, you can view this free graph of past earnings, revenue and cash flow.
So How Is Maxim Power's ROCE Trending?
The fact that Maxim Power is now generating some pre-tax profits from its prior investments is very encouraging. The company was generating losses five years ago, but now it's earning 8.6% which is a sight for sore eyes. In addition to that, Maxim Power is employing 100% more capital than previously which is expected of a company that's trying to break into profitability. We like this trend, because it tells us the company has profitable reinvestment opportunities available to it, and if it continues going forward that can lead to a multi-bagger performance.
On a related note, the company's ratio of current liabilities to total assets has decreased to 6.0%, which basically reduces it's funding from the likes of short-term creditors or suppliers. So this improvement in ROCE has come from the business' underlying economics, which is great to see.
The Key Takeaway
In summary, it's great to see that Maxim Power has managed to break into profitability and is continuing to reinvest in its business. Investors may not be impressed by the favorable underlying trends yet because over the last five years the stock has only returned 19% to shareholders. Given that, we'd look further into this stock in case it has more traits that could make it multiply in the long term.
One more thing: We've identified 2 warning signs with Maxim Power (at least 1 which is a bit concerning) , and understanding them would certainly be useful.
If you want to search for solid companies with great earnings, check out this free list of companies with good balance sheets and impressive returns on equity.
Have feedback on this article? Concerned about the content? Get in touch with us directly. Alternatively, email editorial-team (at) simplywallst.com.
This article by Simply Wall St is general in nature. We provide commentary based on historical data and analyst forecasts only using an unbiased methodology and our articles are not intended to be financial advice. It does not constitute a recommendation to buy or sell any stock, and does not take account of your objectives, or your financial situation. We aim to bring you long-term focused analysis driven by fundamental data. Note that our analysis may not factor in the latest price-sensitive company announcements or qualitative material. Simply Wall St has no position in any stocks mentioned.
Join A Paid User Research Session
You’ll receive a US$30 Amazon Gift card for 1 hour of your time while helping us build better investing tools for the individual investors like yourself. Sign up here
