
 Yahoo Finance
 Maverix Metals Inc.'s (TSE:MMX) Share Price Could Signal Some Risk
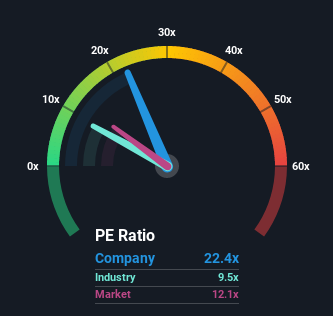
With a price-to-earnings (or "P/E") ratio of 22.4x Maverix Metals Inc. (TSE:MMX) may be sending very bearish signals at the moment, given that almost half of all companies in Canada have P/E ratios under 12x and even P/E's lower than 6x are not unusual. However, the P/E might be quite high for a reason and it requires further investigation to determine if it's justified.
With earnings growth that's superior to most other companies of late, Maverix Metals has been doing relatively well. The P/E is probably high because investors think this strong earnings performance will continue. You'd really hope so, otherwise you're paying a pretty hefty price for no particular reason.
See our latest analysis for Maverix Metals
Want the full picture on analyst estimates for the company? Then our free report on Maverix Metals will help you uncover what's on the horizon.
How Is Maverix Metals' Growth Trending?
In order to justify its P/E ratio, Maverix Metals would need to produce outstanding growth well in excess of the market.
If we review the last year of earnings growth, the company posted a terrific increase of 218%. The latest three year period has also seen an excellent 645% overall rise in EPS, aided by its short-term performance. Accordingly, shareholders would have probably welcomed those medium-term rates of earnings growth.
Turning to the outlook, the next year should bring diminished returns, with earnings decreasing 38% as estimated by the six analysts watching the company. Meanwhile, the broader market is forecast to expand by 11%, which paints a poor picture.
In light of this, it's alarming that Maverix Metals' P/E sits above the majority of other companies. It seems most investors are hoping for a turnaround in the company's business prospects, but the analyst cohort is not so confident this will happen. There's a very good chance these shareholders are setting themselves up for future disappointment if the P/E falls to levels more in line with the negative growth outlook.
The Bottom Line On Maverix Metals' P/E
We'd say the price-to-earnings ratio's power isn't primarily as a valuation instrument but rather to gauge current investor sentiment and future expectations.
Our examination of Maverix Metals' analyst forecasts revealed that its outlook for shrinking earnings isn't impacting its high P/E anywhere near as much as we would have predicted. When we see a poor outlook with earnings heading backwards, we suspect the share price is at risk of declining, sending the high P/E lower. This places shareholders' investments at significant risk and potential investors in danger of paying an excessive premium.
We don't want to rain on the parade too much, but we did also find 4 warning signs for Maverix Metals (1 makes us a bit uncomfortable!) that you need to be mindful of.
Of course, you might find a fantastic investment by looking at a few good candidates. So take a peek at this free list of companies with a strong growth track record, trading on a P/E below 20x.
Have feedback on this article? Concerned about the content? Get in touch with us directly. Alternatively, email editorial-team (at) simplywallst.com.
This article by Simply Wall St is general in nature. We provide commentary based on historical data and analyst forecasts only using an unbiased methodology and our articles are not intended to be financial advice. It does not constitute a recommendation to buy or sell any stock, and does not take account of your objectives, or your financial situation. We aim to bring you long-term focused analysis driven by fundamental data. Note that our analysis may not factor in the latest price-sensitive company announcements or qualitative material. Simply Wall St has no position in any stocks mentioned.
