
 Yahoo Finance
 Martinrea International Inc (TSE:MRE): Did It Outperform The Industry?

After looking at Martinrea International Inc’s (TSE:MRE) latest earnings update (31 March 2018), I found it helpful to revisit the company’s performance in the past couple of years and compare this against the latest numbers. As a long-term investor I tend to focus on earnings trend, rather than a single number at one point in time. Also, comparing it against an industry benchmark to understand whether it outperformed, or is simply riding an industry wave, is an important aspect. In this article I briefly touch on my key findings.
View our latest analysis for Martinrea International
Were MRE’s earnings stronger than its past performances and the industry?
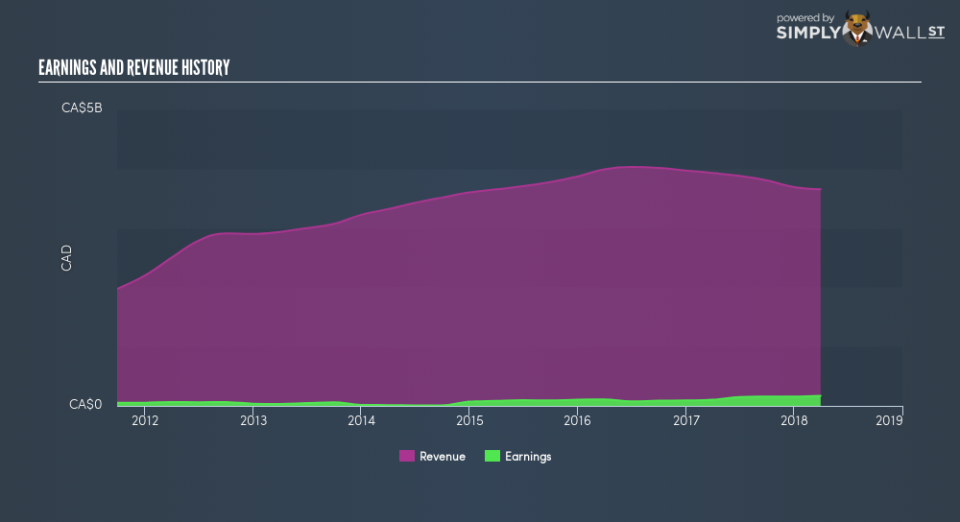
MRE’s trailing twelve-month earnings (from 31 March 2018) of CA$171.90m has jumped 66.23% compared to the previous year. Furthermore, this one-year growth rate has exceeded its 5-year annual growth average of 22.77%, indicating the rate at which MRE is growing has accelerated. What’s enabled this growth? Well, let’s take a look at whether it is solely owing to industry tailwinds, or if Martinrea International has seen some company-specific growth.
Over the past couple of years, Martinrea International increased its bottom line faster than revenue by effectively controlling its costs. This has led to a margin expansion and profitability over time. Inspecting growth from a sector-level, the Canadian auto components industry has been growing its average earnings by double-digit 10.74% over the prior year, and 11.58% over the past five years. Since the Auto Components sector in CA is relatively small, I’ve included similar companies in the wider region in order to get a better idea of the growth, which is a median of profitable companies of companies such as Linamar, Magna International and . This suggests that any tailwind the industry is enjoying, Martinrea International is able to leverage this to its advantage.
In terms of returns from investment, Martinrea International has not invested its equity funds well, leading to a 16.32% return on equity (ROE), below the sensible minimum of 20%. However, its return on assets (ROA) of 7.08% exceeds the CA Auto Components industry of 6.82%, indicating Martinrea International has used its assets more efficiently. And finally, its return on capital (ROC), which also accounts for Martinrea International’s debt level, has increased over the past 3 years from 8.13% to 12.96%. This correlates with a decrease in debt holding, with debt-to-equity ratio declining from 75.22% to 64.37% over the past 5 years.
What does this mean?
Though Martinrea International’s past data is helpful, it is only one aspect of my investment thesis. Companies that have performed well in the past, such as Martinrea International gives investors conviction. However, the next step would be to assess whether the future looks as optimistic. I suggest you continue to research Martinrea International to get a more holistic view of the stock by looking at:
Future Outlook: What are well-informed industry analysts predicting for MRE’s future growth? Take a look at our free research report of analyst consensus for MRE’s outlook.
Financial Health: Are MRE’s operations financially sustainable? Balance sheets can be hard to analyze, which is why we’ve done it for you. Check out our financial health checks here.
Other High-Performing Stocks: Are there other stocks that provide better prospects with proven track records? Explore our free list of these great stocks here.
NB: Figures in this article are calculated using data from the trailing twelve months from 31 March 2018. This may not be consistent with full year annual report figures.
To help readers see past the short term volatility of the financial market, we aim to bring you a long-term focused research analysis purely driven by fundamental data. Note that our analysis does not factor in the latest price-sensitive company announcements.
The author is an independent contributor and at the time of publication had no position in the stocks mentioned. For errors that warrant correction please contact the editor at editorial-team@simplywallst.com.
