
 Yahoo Finance
 Marriott Vacations (VAC) Q3 Earnings Miss Estimates, Up Y/Y
Marriott Vacations Worldwide Corporation VAC reported mixed results for the third quarter of 2019, wherein earnings missed the Zacks Consensus Estimate but revenues beat the same.
Adjusted earnings of $1.97 per share missed the consensus mark of $2.04 by 3.4% but increased 38.7% year over year.
Quarterly revenues were $1,139 million, which beat the Zacks Consensus Estimate of $1,127 million by 1.1% and surged 51.9% from the year-ago quarter’s figure. The upside can be attributed to improvement in consolidated vacation ownership contract sales.
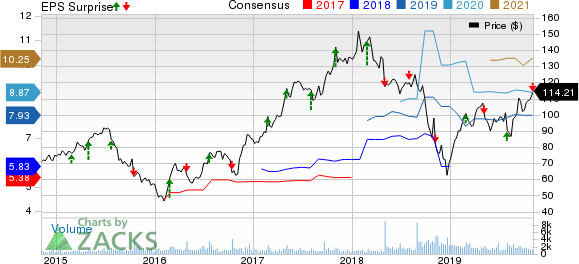
Marriot Vacations Worldwide Corporation Price, Consensus and EPS Surprise
Segmental Performances
Vacation Ownership: Consolidated Vacation Ownership contract sales totaled $390 million, up 40% year over year on a combined basis. Revenues, excluding cost reimbursements, increased 4% year over year. Consolidated contract sales rose nearly 5% on a year-over-year basis. Contract sales in the quarter were affected by $7 million due to a hurricane. Legacy-MVW contract sales amounted to $244 million, up 1% year over year. Legacy-MVW North America volume per guest (“VPG”) amounted to $3,789 million, almost flat year over year.
Rental revenues in the third quarter were $135 million, up nearly 57% from year-ago quarter’s figure.
On a combined basis, the segment’s adjusted EBITDA increased 11% year over year to $195 million in the third quarter. Adjusted EBITDA margin improved 180 basis points from the year-ago quarter’s figure, excluding cost reimbursements.
Exchange & Third-Party Management: The segment’s revenues totaled $112 million in the quarter, up from year-ago quarter’s figure of $40 million. Total Interval Network active members were 1.7 million at the end of the quarter and average revenue per member was $40.89.
The segment’s adjusted EBITDA, on a combined basis, was $56 million. The figure declined 7% year over year (after excluding VRI Europe from year-ago quarter’s level).
Corporate and Other results
The segment - which primarily consist of general and administrative costs, decreased $19 million year over year, owing to synergy savings and lower compensation related expenses, partially offset by normal inflationary cost increases.
Expenses & EBITDA
Total expenses in the quarter amounted to $1,069 million, up 53.2% year over year. Rise in expenses were caused by an increase in the cost of vacation ownership products as well as high rental, financing and administrative costs. Higher marketing and sales expenses along with management and exchange costs affected total costs. The company’s adjusted EBITDA in the third quarter was $190 million, which surged 90% from the year-ago quarter’s level.
Balance Sheet
Cash and cash equivalents, as of Sep 30, 2019, was $183 million compared with $231 million as of 2018 end. Inventory declined to $840 million from $863 million at 2018-end. The company had $4 billion in debt outstanding (net of unamortized debt issuance costs) at the end of the third quarter.
2019 Outlook
During the reported quarter, the company’s properties in the Vacation Ownership segment were adversely impacted by a hurricane. The company undertook mandatory evacuations, shut resort and sales center, and cancel reservations and scheduled tours.
For 2019, the company expects adjusted earnings of $7.67-$8.16 per share, up from the previous guidance of $7.65-$8.14. The Zacks Consensus Estimate for earnings is pegged at $7.68 for the year. Adjusted EBITDA is projected between $745 million and $775 million, compared with previous expectation of $750-$780 million.
Consolidated contract sales growth is likely to be in the range of 5-8% in 2019. Adjusted free cash flow is anticipated in the range of $440-$490 million.
Zacks Rank & Key Picks
Currently, Marriott carries a Zacks Rank #3 (Hold). You can see the complete list of today’s Zacks #1 Rank (Strong Buy) stocks here.
Some better-ranked stocks in the Zacks Consumer Discretionary Sector include Civeo Corporation CVEO, TEGNA Inc TGNA and Lifetime Brands, Inc LCUT. Civeo and TEGNA sport a Zack Rank #1(Strong Buy), while Lifetime Brands carries a Zacks Rank #2 (Buy).
Civeo’s current year earnings are expected to rise 75.8%.
TEGNA has a long-term earnings growth rate of 10%.
Lifetime Brands has three-five year expected earnings growth rate of 15%.
More Stock News: This Is Bigger than the iPhone!
It could become the mother of all technological revolutions. Apple sold a mere 1 billion iPhones in 10 years but a new breakthrough is expected to generate more than 27 billion devices in just 3 years, creating a $1.7 trillion market.
Zacks has just released a Special Report that spotlights this fast-emerging phenomenon and 6 tickers for taking advantage of it. If you don't buy now, you may kick yourself in 2020.
Click here for the 6 trades >>
Click to get this free report Marriot Vacations Worldwide Corporation (VAC) : Free Stock Analysis Report Civeo Corporation (CVEO) : Free Stock Analysis Report TEGNA Inc. (TGNA) : Free Stock Analysis Report Lifetime Brands, Inc. (LCUT) : Free Stock Analysis Report To read this article on Zacks.com click here. Zacks Investment Research
