
 Yahoo Finance
 Market Sentiment Around Loss-Making UGE International Ltd. (CVE:UGE)
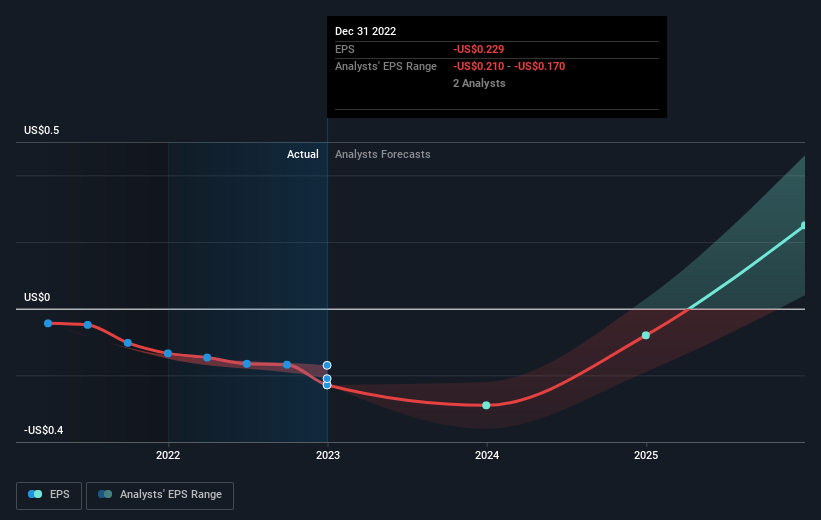
With the business potentially at an important milestone, we thought we'd take a closer look at UGE International Ltd.'s (CVE:UGE) future prospects. UGE International Ltd., a solar and renewable energy solutions company, provides commercial and community solar energy solutions to commercial and industrial clients in Canada, the United States, and the Philippines. On 31 December 2022, the CA$42m market-cap company posted a loss of US$7.4m for its most recent financial year. Many investors are wondering about the rate at which UGE International will turn a profit, with the big question being “when will the company breakeven?” We've put together a brief outline of industry analyst expectations for the company, its year of breakeven and its implied growth rate.
View our latest analysis for UGE International
According to the 4 industry analysts covering UGE International, the consensus is that breakeven is near. They expect the company to post a final loss in 2024, before turning a profit of US$9.5m in 2025. Therefore, the company is expected to breakeven roughly 2 years from today. In order to meet this breakeven date, we calculated the rate at which the company must grow year-on-year. It turns out an average annual growth rate of 59% is expected, which is extremely buoyant. Should the business grow at a slower rate, it will become profitable at a later date than expected.
Given this is a high-level overview, we won’t go into details of UGE International's upcoming projects, but, keep in mind that generally a high growth rate is not out of the ordinary, particularly when a company is in a period of investment.
One thing we would like to bring into light with UGE International is it currently has negative equity on its balance sheet. Accounting methods used to deal with losses accumulated over time can cause this to occur. This is because liabilities are carried forward into the future until it cancels. Oftentimes, losses exist only on paper but other times, it can be a red flag.
Next Steps:
There are key fundamentals of UGE International which are not covered in this article, but we must stress again that this is merely a basic overview. For a more comprehensive look at UGE International, take a look at UGE International's company page on Simply Wall St. We've also put together a list of important factors you should look at:
Valuation: What is UGE International worth today? Has the future growth potential already been factored into the price? The intrinsic value infographic in our free research report helps visualize whether UGE International is currently mispriced by the market.
Management Team: An experienced management team on the helm increases our confidence in the business – take a look at who sits on UGE International’s board and the CEO’s background.
Other High-Performing Stocks: Are there other stocks that provide better prospects with proven track records? Explore our free list of these great stocks here.
Have feedback on this article? Concerned about the content? Get in touch with us directly. Alternatively, email editorial-team (at) simplywallst.com.
This article by Simply Wall St is general in nature. We provide commentary based on historical data and analyst forecasts only using an unbiased methodology and our articles are not intended to be financial advice. It does not constitute a recommendation to buy or sell any stock, and does not take account of your objectives, or your financial situation. We aim to bring you long-term focused analysis driven by fundamental data. Note that our analysis may not factor in the latest price-sensitive company announcements or qualitative material. Simply Wall St has no position in any stocks mentioned.
Join A Paid User Research Session
You’ll receive a US$30 Amazon Gift card for 1 hour of your time while helping us build better investing tools for the individual investors like yourself. Sign up here
