
 Yahoo Finance
 What Is Marathon Oil's (NYSE:MRO) P/E Ratio After Its Share Price Rocketed?

Those holding Marathon Oil (NYSE:MRO) shares must be pleased that the share price has rebounded 40% in the last thirty days. But unfortunately, the stock is still down by 58% over a quarter. But that will do little to salve the savage burn caused by the 71% share price decline, over the last year.
All else being equal, a sharp share price increase should make a stock less attractive to potential investors. In the long term, share prices tend to follow earnings per share, but in the short term prices bounce around in response to short term factors (which are not always obvious). The implication here is that deep value investors might steer clear when expectations of a company are too high. Perhaps the simplest way to get a read on investors' expectations of a business is to look at its Price to Earnings Ratio (PE Ratio). A high P/E ratio means that investors have a high expectation about future growth, while a low P/E ratio means they have low expectations about future growth.
See our latest analysis for Marathon Oil
Does Marathon Oil Have A Relatively High Or Low P/E For Its Industry?
Marathon Oil's P/E is 8.32. The image below shows that Marathon Oil has a P/E ratio that is roughly in line with the oil and gas industry average (8.5).
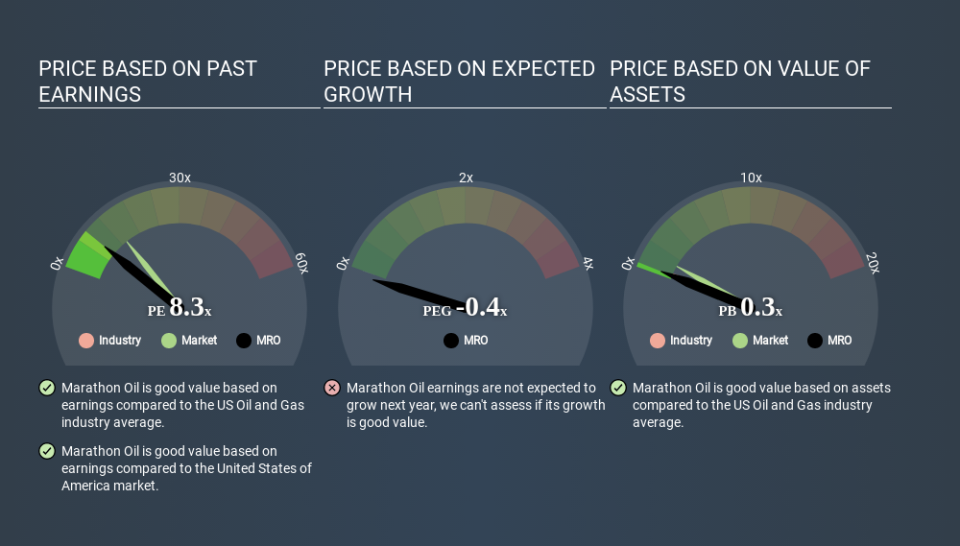
That indicates that the market expects Marathon Oil will perform roughly in line with other companies in its industry. The company could surprise by performing better than average, in the future. Checking factors such as director buying and selling. could help you form your own view on if that will happen.
How Growth Rates Impact P/E Ratios
P/E ratios primarily reflect market expectations around earnings growth rates. Earnings growth means that in the future the 'E' will be higher. And in that case, the P/E ratio itself will drop rather quickly. A lower P/E should indicate the stock is cheap relative to others -- and that may attract buyers.
Marathon Oil shrunk earnings per share by 54% over the last year. And over the longer term (5 years) earnings per share have decreased 16% annually. This might lead to muted expectations.
A Limitation: P/E Ratios Ignore Debt and Cash In The Bank
Don't forget that the P/E ratio considers market capitalization. So it won't reflect the advantage of cash, or disadvantage of debt. In theory, a company can lower its future P/E ratio by using cash or debt to invest in growth.
While growth expenditure doesn't always pay off, the point is that it is a good option to have; but one that the P/E ratio ignores.
Marathon Oil's Balance Sheet
Marathon Oil has net debt worth a very significant 119% of its market capitalization. This level of debt justifies a relatively low P/E, so remain cognizant of the debt, if you're comparing it to other stocks.
The Verdict On Marathon Oil's P/E Ratio
Marathon Oil has a P/E of 8.3. That's below the average in the US market, which is 13.5. The P/E reflects market pessimism that probably arises from the lack of recent EPS growth, paired with significant leverage. What we know for sure is that investors are becoming less uncomfortable about Marathon Oil's prospects, since they have pushed its P/E ratio from 5.9 to 8.3 over the last month. For those who like to invest in turnarounds, that might mean it's time to put the stock on a watchlist, or research it. But others might consider the opportunity to have passed.
Investors should be looking to buy stocks that the market is wrong about. If the reality for a company is not as bad as the P/E ratio indicates, then the share price should increase as the market realizes this. So this free visual report on analyst forecasts could hold the key to an excellent investment decision.
Of course, you might find a fantastic investment by looking at a few good candidates. So take a peek at this free list of companies with modest (or no) debt, trading on a P/E below 20.
If you spot an error that warrants correction, please contact the editor at editorial-team@simplywallst.com. This article by Simply Wall St is general in nature. It does not constitute a recommendation to buy or sell any stock, and does not take account of your objectives, or your financial situation. Simply Wall St has no position in the stocks mentioned.
We aim to bring you long-term focused research analysis driven by fundamental data. Note that our analysis may not factor in the latest price-sensitive company announcements or qualitative material. Thank you for reading.
