
 Yahoo Finance
 ManpowerGroup (NYSE:MAN) Will Be Looking To Turn Around Its Returns
When researching a stock for investment, what can tell us that the company is in decline? Businesses in decline often have two underlying trends, firstly, a declining return on capital employed (ROCE) and a declining base of capital employed. Trends like this ultimately mean the business is reducing its investments and also earning less on what it has invested. In light of that, from a first glance at ManpowerGroup (NYSE:MAN), we've spotted some signs that it could be struggling, so let's investigate.
Understanding Return On Capital Employed (ROCE)
If you haven't worked with ROCE before, it measures the 'return' (pre-tax profit) a company generates from capital employed in its business. Analysts use this formula to calculate it for ManpowerGroup:
Return on Capital Employed = Earnings Before Interest and Tax (EBIT) ÷ (Total Assets - Current Liabilities)
0.16 = US$657m ÷ (US$9.1b - US$4.9b) (Based on the trailing twelve months to December 2022).
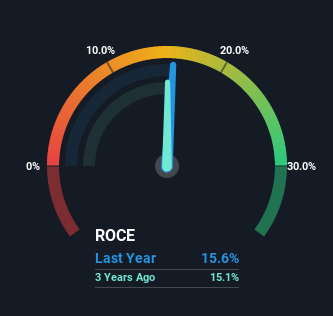
Thus, ManpowerGroup has an ROCE of 16%. In absolute terms, that's a satisfactory return, but compared to the Professional Services industry average of 12% it's much better.
View our latest analysis for ManpowerGroup
In the above chart we have measured ManpowerGroup's prior ROCE against its prior performance, but the future is arguably more important. If you're interested, you can view the analysts predictions in our free report on analyst forecasts for the company.
The Trend Of ROCE
We are a bit worried about the trend of returns on capital at ManpowerGroup. About five years ago, returns on capital were 20%, however they're now substantially lower than that as we saw above. And on the capital employed front, the business is utilizing roughly the same amount of capital as it was back then. Since returns are falling and the business has the same amount of assets employed, this can suggest it's a mature business that hasn't had much growth in the last five years. If these trends continue, we wouldn't expect ManpowerGroup to turn into a multi-bagger.
On a separate but related note, it's important to know that ManpowerGroup has a current liabilities to total assets ratio of 54%, which we'd consider pretty high. This effectively means that suppliers (or short-term creditors) are funding a large portion of the business, so just be aware that this can introduce some elements of risk. Ideally we'd like to see this reduce as that would mean fewer obligations bearing risks.
The Key Takeaway
In summary, it's unfortunate that ManpowerGroup is generating lower returns from the same amount of capital. Investors haven't taken kindly to these developments, since the stock has declined 21% from where it was five years ago. Unless there is a shift to a more positive trajectory in these metrics, we would look elsewhere.
Like most companies, ManpowerGroup does come with some risks, and we've found 1 warning sign that you should be aware of.
While ManpowerGroup may not currently earn the highest returns, we've compiled a list of companies that currently earn more than 25% return on equity. Check out this free list here.
Have feedback on this article? Concerned about the content? Get in touch with us directly. Alternatively, email editorial-team (at) simplywallst.com.
This article by Simply Wall St is general in nature. We provide commentary based on historical data and analyst forecasts only using an unbiased methodology and our articles are not intended to be financial advice. It does not constitute a recommendation to buy or sell any stock, and does not take account of your objectives, or your financial situation. We aim to bring you long-term focused analysis driven by fundamental data. Note that our analysis may not factor in the latest price-sensitive company announcements or qualitative material. Simply Wall St has no position in any stocks mentioned.
Join A Paid User Research Session
You’ll receive a US$30 Amazon Gift card for 1 hour of your time while helping us build better investing tools for the individual investors like yourself. Sign up here
