
 Yahoo Finance
 Mandalay Resources Corporation (TSE:MND) Stock Catapults 26% Though Its Price And Business Still Lag The Market
The Mandalay Resources Corporation (TSE:MND) share price has done very well over the last month, posting an excellent gain of 26%. The last 30 days bring the annual gain to a very sharp 46%.
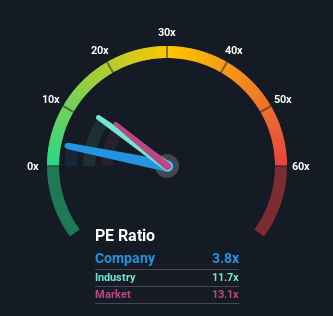
Although its price has surged higher, Mandalay Resources may still be sending very bullish signals at the moment with its price-to-earnings (or "P/E") ratio of 3.8x, since almost half of all companies in Canada have P/E ratios greater than 14x and even P/E's higher than 32x are not unusual. Nonetheless, we'd need to dig a little deeper to determine if there is a rational basis for the highly reduced P/E.
Mandalay Resources certainly has been doing a great job lately as it's been growing earnings at a really rapid pace. It might be that many expect the strong earnings performance to degrade substantially, which has repressed the P/E. If you like the company, you'd be hoping this isn't the case so that you could potentially pick up some stock while it's out of favour.
Check out our latest analysis for Mandalay Resources
Although there are no analyst estimates available for Mandalay Resources, take a look at this free data-rich visualisation to see how the company stacks up on earnings, revenue and cash flow.
Does Growth Match The Low P/E?
Mandalay Resources' P/E ratio would be typical for a company that's expected to deliver very poor growth or even falling earnings, and importantly, perform much worse than the market.
Retrospectively, the last year delivered an exceptional 488% gain to the company's bottom line. Still, EPS has barely risen at all from three years ago in total, which is not ideal. So it appears to us that the company has had a mixed result in terms of growing earnings over that time.
This is in contrast to the rest of the market, which is expected to grow by 11% over the next year, materially higher than the company's recent medium-term annualised growth rates.
With this information, we can see why Mandalay Resources is trading at a P/E lower than the market. It seems most investors are expecting to see the recent limited growth rates continue into the future and are only willing to pay a reduced amount for the stock.
What We Can Learn From Mandalay Resources' P/E?
Mandalay Resources' recent share price jump still sees its P/E sitting firmly flat on the ground. While the price-to-earnings ratio shouldn't be the defining factor in whether you buy a stock or not, it's quite a capable barometer of earnings expectations.
As we suspected, our examination of Mandalay Resources revealed its three-year earnings trends are contributing to its low P/E, given they look worse than current market expectations. Right now shareholders are accepting the low P/E as they concede future earnings probably won't provide any pleasant surprises. Unless the recent medium-term conditions improve, they will continue to form a barrier for the share price around these levels.
There are also other vital risk factors to consider and we've discovered 3 warning signs for Mandalay Resources (2 are a bit unpleasant!) that you should be aware of before investing here.
It's important to make sure you look for a great company, not just the first idea you come across. So take a peek at this free list of interesting companies with strong recent earnings growth (and a P/E ratio below 20x).
Have feedback on this article? Concerned about the content? Get in touch with us directly. Alternatively, email editorial-team (at) simplywallst.com.
This article by Simply Wall St is general in nature. We provide commentary based on historical data and analyst forecasts only using an unbiased methodology and our articles are not intended to be financial advice. It does not constitute a recommendation to buy or sell any stock, and does not take account of your objectives, or your financial situation. We aim to bring you long-term focused analysis driven by fundamental data. Note that our analysis may not factor in the latest price-sensitive company announcements or qualitative material. Simply Wall St has no position in any stocks mentioned.
