
 Yahoo Finance
 MAN SE (FRA:MAN): Time For A Financial Health Check

Want to participate in a short research study? Help shape the future of investing tools and you could win a $250 gift card!
Small-caps and large-caps are wildly popular among investors; however, mid-cap stocks, such as MAN SE (FRA:MAN) with a market-capitalization of €8.3b, rarely draw their attention. However, generally ignored mid-caps have historically delivered better risk adjusted returns than both of those groups. MAN’s financial liquidity and debt position will be analysed in this article, to get an idea of whether the company can fund opportunities for strategic growth and maintain strength through economic downturns. Don’t forget that this is a general and concentrated examination of MAN’s financial health, so you should conduct further analysis into MAN here.
View our latest analysis for MAN
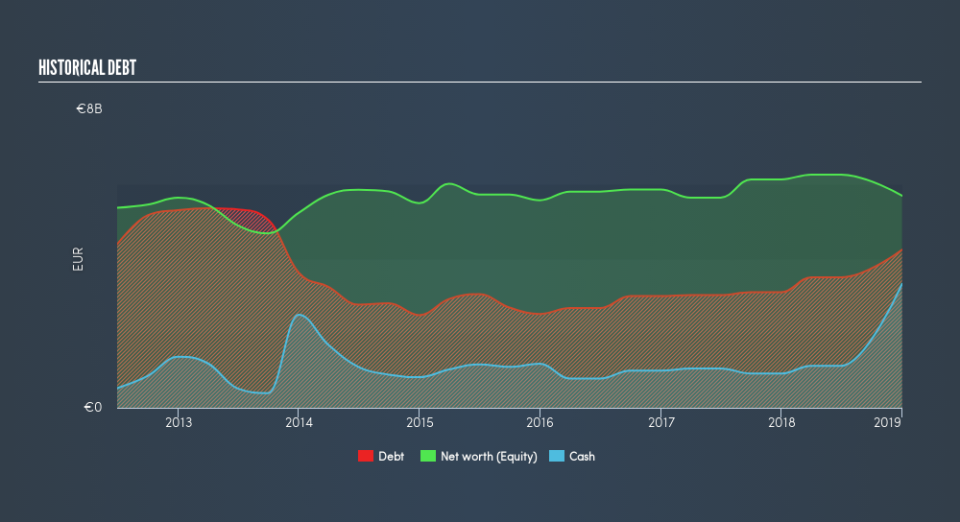
MAN’s Debt (And Cash Flows)
MAN's debt levels surged from €3.1b to €4.2b over the last 12 months , which includes long-term debt. With this rise in debt, MAN's cash and short-term investments stands at €3.3b to keep the business going. Moreover, MAN has produced €544m in operating cash flow in the last twelve months, leading to an operating cash to total debt ratio of 13%, meaning that MAN’s operating cash is less than its debt.
Does MAN’s liquid assets cover its short-term commitments?
At the current liabilities level of €8.6b, it appears that the company arguably has a rather low level of current assets relative its obligations, with the current ratio last standing at 0.85x. The current ratio is the number you get when you divide current assets by current liabilities.
Can MAN service its debt comfortably?
MAN is a relatively highly levered company with a debt-to-equity of 75%. This is not uncommon for a mid-cap company given that debt tends to be lower-cost and at times, more accessible. We can check to see whether MAN is able to meet its debt obligations by looking at the net interest coverage ratio. A company generating earnings before interest and tax (EBIT) at least three times its net interest payments is considered financially sound. In MAN's, case, the ratio of 13.17x suggests that interest is comfortably covered, which means that lenders may be inclined to lend more money to the company, as it is seen as safe in terms of payback.
Next Steps:
MAN’s high cash coverage means that, although its debt levels are high, the company is able to utilise its borrowings efficiently in order to generate cash flow. But, its lack of liquidity raises questions over current asset management practices for the mid-cap. I admit this is a fairly basic analysis for MAN's financial health. Other important fundamentals need to be considered alongside. I recommend you continue to research MAN to get a more holistic view of the stock by looking at:
Future Outlook: What are well-informed industry analysts predicting for MAN’s future growth? Take a look at our free research report of analyst consensus for MAN’s outlook.
Historical Performance: What has MAN's returns been like over the past? Go into more detail in the past track record analysis and take a look at the free visual representations of our analysis for more clarity.
Other High-Performing Stocks: Are there other stocks that provide better prospects with proven track records? Explore our free list of these great stocks here.
We aim to bring you long-term focused research analysis driven by fundamental data. Note that our analysis may not factor in the latest price-sensitive company announcements or qualitative material.
If you spot an error that warrants correction, please contact the editor at editorial-team@simplywallst.com. This article by Simply Wall St is general in nature. It does not constitute a recommendation to buy or sell any stock, and does not take account of your objectives, or your financial situation. Simply Wall St has no position in the stocks mentioned. Thank you for reading.
