
 Yahoo Finance
 Magna International Inc. (TSE:MG) Delivered A Better ROE Than Its Industry

While some investors are already well versed in financial metrics (hat tip), this article is for those who would like to learn about Return On Equity (ROE) and why it is important. To keep the lesson grounded in practicality, we'll use ROE to better understand Magna International Inc. (TSE:MG).
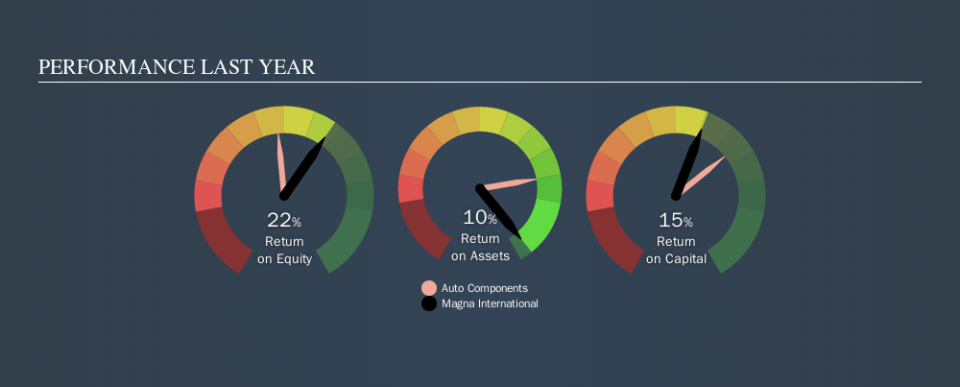
Our data shows Magna International has a return on equity of 22% for the last year. One way to conceptualize this, is that for each CA$1 of shareholders' equity it has, the company made CA$0.22 in profit.
Check out our latest analysis for Magna International
How Do I Calculate ROE?
The formula for return on equity is:
Return on Equity = Net Profit ÷ Shareholders' Equity
Or for Magna International:
22% = US$2.6b ÷ US$12b (Based on the trailing twelve months to June 2019.)
Most readers would understand what net profit is, but it’s worth explaining the concept of shareholders’ equity. It is all the money paid into the company from shareholders, plus any earnings retained. Shareholders' equity can be calculated by subtracting the total liabilities of the company from the total assets of the company.
What Does ROE Mean?
ROE measures a company's profitability against the profit it retains, and any outside investments. The 'return' is the yearly profit. The higher the ROE, the more profit the company is making. So, all else equal, investors should like a high ROE. Clearly, then, one can use ROE to compare different companies.
Does Magna International Have A Good ROE?
By comparing a company's ROE with its industry average, we can get a quick measure of how good it is. The limitation of this approach is that some companies are quite different from others, even within the same industry classification. Pleasingly, Magna International has a superior ROE than the average (15%) company in the Auto Components industry.
That's what I like to see. In my book, a high ROE almost always warrants a closer look. For example you might check if insiders are buying shares.
How Does Debt Impact Return On Equity?
Virtually all companies need money to invest in the business, to grow profits. The cash for investment can come from prior year profits (retained earnings), issuing new shares, or borrowing. In the first two cases, the ROE will capture this use of capital to grow. In the latter case, the debt used for growth will improve returns, but won't affect the total equity. That will make the ROE look better than if no debt was used.
Combining Magna International's Debt And Its 22% Return On Equity
Although Magna International does use debt, its debt to equity ratio of 0.28 is still low. The combination of modest debt and a very respectable ROE suggests this is a business worth watching. Conservative use of debt to boost returns is usually a good move for shareholders, though it does leave the company more exposed to interest rate rises.
The Bottom Line On ROE
Return on equity is useful for comparing the quality of different businesses. In my book the highest quality companies have high return on equity, despite low debt. If two companies have the same ROE, then I would generally prefer the one with less debt.
But when a business is high quality, the market often bids it up to a price that reflects this. The rate at which profits are likely to grow, relative to the expectations of profit growth reflected in the current price, must be considered, too. So you might want to take a peek at this data-rich interactive graph of forecasts for the company.
Of course, you might find a fantastic investment by looking elsewhere. So take a peek at this free list of interesting companies.
We aim to bring you long-term focused research analysis driven by fundamental data. Note that our analysis may not factor in the latest price-sensitive company announcements or qualitative material.
If you spot an error that warrants correction, please contact the editor at editorial-team@simplywallst.com. This article by Simply Wall St is general in nature. It does not constitute a recommendation to buy or sell any stock, and does not take account of your objectives, or your financial situation. Simply Wall St has no position in the stocks mentioned. Thank you for reading.
