
 Yahoo Finance
 M.D.C. Holdings' (NYSE:MDC) five-year total shareholder returns outpace the underlying earnings growth
Generally speaking the aim of active stock picking is to find companies that provide returns that are superior to the market average. And in our experience, buying the right stocks can give your wealth a significant boost. For example, long term M.D.C. Holdings, Inc. (NYSE:MDC) shareholders have enjoyed a 53% share price rise over the last half decade, well in excess of the market return of around 42% (not including dividends).
Since the long term performance has been good but there's been a recent pullback of 5.4%, let's check if the fundamentals match the share price.
See our latest analysis for M.D.C. Holdings
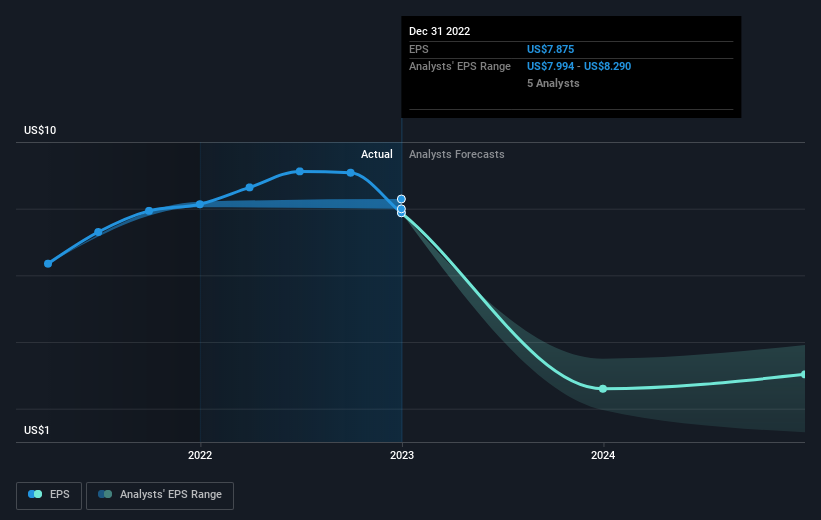
While markets are a powerful pricing mechanism, share prices reflect investor sentiment, not just underlying business performance. One flawed but reasonable way to assess how sentiment around a company has changed is to compare the earnings per share (EPS) with the share price.
During five years of share price growth, M.D.C. Holdings achieved compound earnings per share (EPS) growth of 29% per year. The EPS growth is more impressive than the yearly share price gain of 9% over the same period. So it seems the market isn't so enthusiastic about the stock these days. The reasonably low P/E ratio of 4.72 also suggests market apprehension.
The graphic below depicts how EPS has changed over time (unveil the exact values by clicking on the image).
Dive deeper into M.D.C. Holdings' key metrics by checking this interactive graph of M.D.C. Holdings's earnings, revenue and cash flow.
What About Dividends?
As well as measuring the share price return, investors should also consider the total shareholder return (TSR). Whereas the share price return only reflects the change in the share price, the TSR includes the value of dividends (assuming they were reinvested) and the benefit of any discounted capital raising or spin-off. Arguably, the TSR gives a more comprehensive picture of the return generated by a stock. As it happens, M.D.C. Holdings' TSR for the last 5 years was 87%, which exceeds the share price return mentioned earlier. And there's no prize for guessing that the dividend payments largely explain the divergence!
A Different Perspective
The total return of 5.4% received by M.D.C. Holdings shareholders over the last year isn't far from the market return of -5.7%. Longer term investors wouldn't be so upset, since they would have made 13%, each year, over five years. If the fundamental data remains strong, and the share price is simply down on sentiment, then this could be an opportunity worth investigating. It's always interesting to track share price performance over the longer term. But to understand M.D.C. Holdings better, we need to consider many other factors. For example, we've discovered 3 warning signs for M.D.C. Holdings (1 is a bit concerning!) that you should be aware of before investing here.
If you like to buy stocks alongside management, then you might just love this free list of companies. (Hint: insiders have been buying them).
Please note, the market returns quoted in this article reflect the market weighted average returns of stocks that currently trade on US exchanges.
Have feedback on this article? Concerned about the content? Get in touch with us directly. Alternatively, email editorial-team (at) simplywallst.com.
This article by Simply Wall St is general in nature. We provide commentary based on historical data and analyst forecasts only using an unbiased methodology and our articles are not intended to be financial advice. It does not constitute a recommendation to buy or sell any stock, and does not take account of your objectives, or your financial situation. We aim to bring you long-term focused analysis driven by fundamental data. Note that our analysis may not factor in the latest price-sensitive company announcements or qualitative material. Simply Wall St has no position in any stocks mentioned.
Join A Paid User Research Session
You’ll receive a US$30 Amazon Gift card for 1 hour of your time while helping us build better investing tools for the individual investors like yourself. Sign up here
