
 Yahoo Finance
 Lookers (LON:LOOK) shareholders have earned a 18% CAGR over the last three years
By buying an index fund, investors can approximate the average market return. But if you choose individual stocks with prowess, you can make superior returns. Just take a look at Lookers plc (LON:LOOK), which is up 54%, over three years, soundly beating the market decline of 6.1% (not including dividends). On the other hand, the returns haven't been quite so good recently, with shareholders up just 16% , including dividends .
So let's investigate and see if the longer term performance of the company has been in line with the underlying business' progress.
Check out our latest analysis for Lookers
To paraphrase Benjamin Graham: Over the short term the market is a voting machine, but over the long term it's a weighing machine. By comparing earnings per share (EPS) and share price changes over time, we can get a feel for how investor attitudes to a company have morphed over time.
During three years of share price growth, Lookers achieved compound earnings per share growth of 80% per year. This EPS growth is higher than the 15% average annual increase in the share price. So one could reasonably conclude that the market has cooled on the stock. This cautious sentiment is reflected in its (fairly low) P/E ratio of 3.94.
The graphic below depicts how EPS has changed over time (unveil the exact values by clicking on the image).
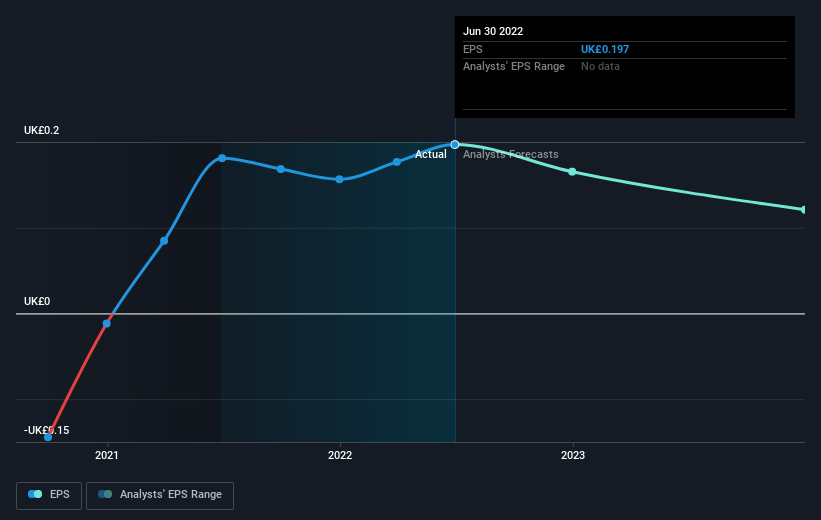
It is of course excellent to see how Lookers has grown profits over the years, but the future is more important for shareholders. If you are thinking of buying or selling Lookers stock, you should check out this FREE detailed report on its balance sheet.
What About Dividends?
When looking at investment returns, it is important to consider the difference between total shareholder return (TSR) and share price return. The TSR is a return calculation that accounts for the value of cash dividends (assuming that any dividend received was reinvested) and the calculated value of any discounted capital raisings and spin-offs. Arguably, the TSR gives a more comprehensive picture of the return generated by a stock. We note that for Lookers the TSR over the last 3 years was 64%, which is better than the share price return mentioned above. And there's no prize for guessing that the dividend payments largely explain the divergence!
A Different Perspective
It's nice to see that Lookers shareholders have received a total shareholder return of 16% over the last year. And that does include the dividend. There's no doubt those recent returns are much better than the TSR loss of 4% per year over five years. The long term loss makes us cautious, but the short term TSR gain certainly hints at a brighter future. While it is well worth considering the different impacts that market conditions can have on the share price, there are other factors that are even more important. Like risks, for instance. Every company has them, and we've spotted 2 warning signs for Lookers (of which 1 is concerning!) you should know about.
Of course, you might find a fantastic investment by looking elsewhere. So take a peek at this free list of companies we expect will grow earnings.
Please note, the market returns quoted in this article reflect the market weighted average returns of stocks that currently trade on GB exchanges.
Have feedback on this article? Concerned about the content? Get in touch with us directly. Alternatively, email editorial-team (at) simplywallst.com.
This article by Simply Wall St is general in nature. We provide commentary based on historical data and analyst forecasts only using an unbiased methodology and our articles are not intended to be financial advice. It does not constitute a recommendation to buy or sell any stock, and does not take account of your objectives, or your financial situation. We aim to bring you long-term focused analysis driven by fundamental data. Note that our analysis may not factor in the latest price-sensitive company announcements or qualitative material. Simply Wall St has no position in any stocks mentioned.
Join A Paid User Research Session
You’ll receive a US$30 Amazon Gift card for 1 hour of your time while helping us build better investing tools for the individual investors like yourself. Sign up here
