
 Yahoo Finance
 Liquidity Services (NASDAQ:LQDT) shareholders have earned a 53% CAGR over the last three years
Liquidity Services, Inc. (NASDAQ:LQDT) shareholders have seen the share price descend 12% over the month. In contrast, the return over three years has been impressive. In three years the stock price has launched 256% higher: a great result. After a run like that some may not be surprised to see prices moderate. If the business can perform well for years to come, then the recent drop could be an opportunity.
So let's assess the underlying fundamentals over the last 3 years and see if they've moved in lock-step with shareholder returns.
View our latest analysis for Liquidity Services
While the efficient markets hypothesis continues to be taught by some, it has been proven that markets are over-reactive dynamic systems, and investors are not always rational. By comparing earnings per share (EPS) and share price changes over time, we can get a feel for how investor attitudes to a company have morphed over time.
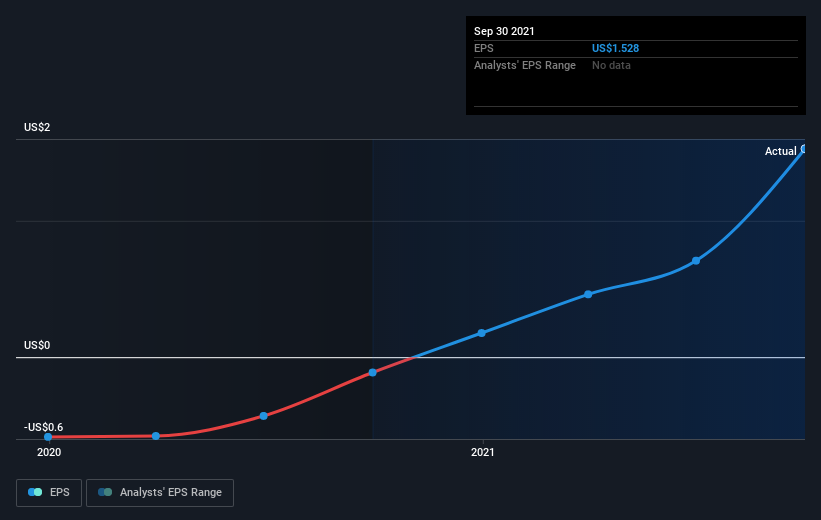
During three years of share price growth, Liquidity Services moved from a loss to profitability. That kind of transition can be an inflection point that justifies a strong share price gain, just as we have seen here.
You can see how EPS has changed over time in the image below (click on the chart to see the exact values).
It is of course excellent to see how Liquidity Services has grown profits over the years, but the future is more important for shareholders. You can see how its balance sheet has strengthened (or weakened) over time in this free interactive graphic.
A Different Perspective
It's nice to see that Liquidity Services shareholders have received a total shareholder return of 35% over the last year. That's better than the annualised return of 18% over half a decade, implying that the company is doing better recently. Given the share price momentum remains strong, it might be worth taking a closer look at the stock, lest you miss an opportunity. While it is well worth considering the different impacts that market conditions can have on the share price, there are other factors that are even more important. Even so, be aware that Liquidity Services is showing 2 warning signs in our investment analysis , you should know about...
If you would prefer to check out another company -- one with potentially superior financials -- then do not miss this free list of companies that have proven they can grow earnings.
Please note, the market returns quoted in this article reflect the market weighted average returns of stocks that currently trade on US exchanges.
Have feedback on this article? Concerned about the content? Get in touch with us directly. Alternatively, email editorial-team (at) simplywallst.com.
This article by Simply Wall St is general in nature. We provide commentary based on historical data and analyst forecasts only using an unbiased methodology and our articles are not intended to be financial advice. It does not constitute a recommendation to buy or sell any stock, and does not take account of your objectives, or your financial situation. We aim to bring you long-term focused analysis driven by fundamental data. Note that our analysis may not factor in the latest price-sensitive company announcements or qualitative material. Simply Wall St has no position in any stocks mentioned.
