Yahoo Finance
 LexinFintech Holdings Ltd. Reports Third Quarter 2022 Unaudited Financial Results

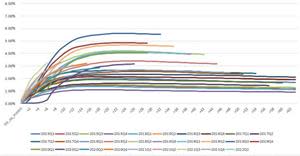
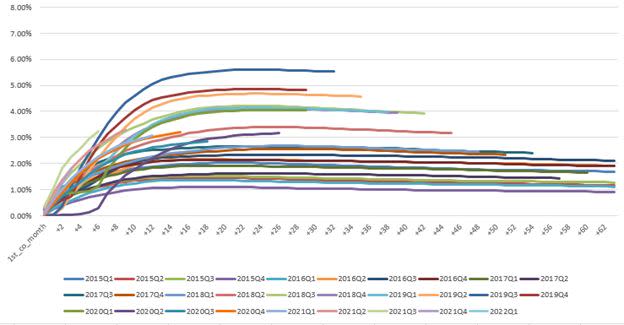
Vintage Charge Off Curve
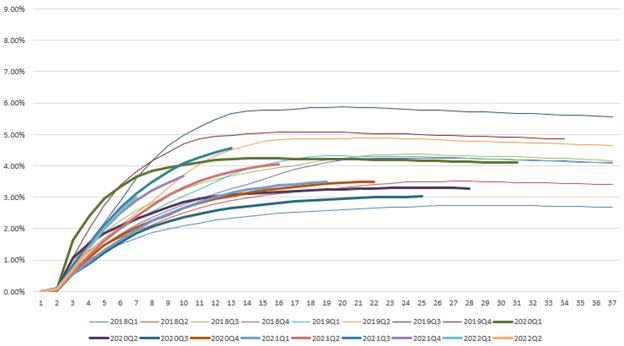
Dpd30+/GMV by Performance Windows

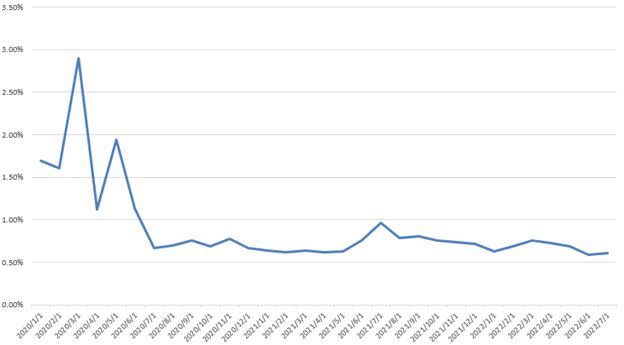
First Payment Default 30+

SHENZHEN, China, Nov. 16, 2022 (GLOBE NEWSWIRE) -- LexinFintech Holdings Ltd. (“Lexin” or the “Company”) (NASDAQ: LX), a leading online and offline consumption platform and a technology-driven service provider in China, today announced its unaudited financial results for the quarter ended September 30, 2022.
“In the third quarter, our total loan originations reached approximately RMB56.2 billion, surpassing our original expectation of RMB53 billion. Other key financial, operational and overall risk level metrics were well on the track of a gradual trajectory of recovery quarter over quarter this year,” said Jay Wenjie Xiao, Lexin's chairman and chief executive officer. “Looking to the future from our current position, we will continue to invest in further tamping of our competencies in data analyzing and technology innovation, to strengthen our other core capabilities down to every detail of our daily operations, risk control and further expand our cooperation with our financial institution partners, and in turn, to further revitalize the Lexin eco-system. We remain focused on the pursuit of prudent and sustainable development in preparation for any potential uncertainties.”
“Our third quarter financial results demonstrated a positive and upward momentum for the fiscal year 2022, supported by our determined efforts in improving asset quality and operational efficiency. On a quarter-over-quarter basis, our operating revenue delivered a 11.5% growth, while net income increased by 64.6%,” said Ms. Sunny Rui Sun, Lexin’s chief financial officer. “Looking ahead, along with our sustained investment in digitalization and technology, we will emphasize on achieving reasonable and sustainable profitability, while maintaining quality topline growth.”
Third Quarter 2022 Operational Highlights:
Total number of registered users reached 184 million as of September 30, 2022, representing an increase of 19.2% from 154 million as of September 30, 2021, and users with credit line reached 39.5 million as of September 30, 2022, up by 10.9% from 35.6 million as of September 30, 2021.
As of September 30, 2022, we cumulatively originated RMB808 billion in loans, an increase of 31.2% from RMB615 billion a year ago.
User Base
Number of active users1 who used our loan products in the third quarter of 2022 was 5.6 million, representing a decrease of 26.8% from 7.7 million in the third quarter of 2021.
Number of new active users who used our loan products in the third quarter of 2022 was 0.5 million, representing a decrease of 66.6% from 1.4 million in the third quarter of 2021.
Loan Facilitation Business
Total loan originations2 in the third quarter of 2022 was RMB56.2 billion, an increase of 0.7% from RMB55.8 billion in the third quarter of 2021.
Total outstanding principal balance of loans2 reached RMB94.6 billion as of September 30, 2022, representing an increase of 1.8% from RMB92.9 billion as of September 30, 2021.
In the third quarter, loan originations for small and micro business owners was RMB5.4 billion.
Number of orders placed on our platform in the third quarter of 2022 was 33.6 million, representing a decrease of 31.6% from 49.1 million in the third quarter of 2021.
Credit Performance
90 day+ delinquency ratio was 2.66% as of September 30, 2022.
First payment default rate (30 day+) for new loan originations was below 1% as of September 30, 2022.
Technology-Driven Platform Services
In the third quarter of 2022, we had served over 100 business customers with our technology-driven platform services.
In the third quarter of 2022, our business customer retention rate3 of technology-driven platform services was over 80%.
New Consumption-Driven, Location-Based Services
The GMV4 in the third quarter of 2022 amounted to RMB1,224 million, representing an increase of 36.7% from RMB895 million in the third quarter of 2021.
In the third quarter of 2022, we served over 378,000 users and 2,800 merchants under new consumption-driven, location-based services.
Other Operational Highlights
The weighted average tenor of loans originated on our platform in the third quarter of 2022 was approximately 13.8 months, representing an increase from 11.0 months in the third quarter of 2021. The nominal APR5 was 15.7% for the third quarter of 2022, representing an increase from 14.0% in the third quarter of 2021.
Third Quarter 2022 Financial Highlights:
Total operating revenue was RMB2,690 million, representing a decrease of 9.4% from the third quarter of 2021.
Revenue from new consumption-driven, location-based services was RMB525 million, representing an increase of 31.3% from the third quarter of 2021. Cost of sales from new consumption-driven, location-based services was RMB531 million, representing an increase of 21.4% from in the third quarter of 2021. Gross margin from new consumption-driven, location-based services was negative RMB5.7 million, which was 84.7% smaller than the negative amount of RMB 37.2 million in the third quarter of 2021.
Net income attributable to ordinary shareholders of the Company was RMB275 million, representing a decrease of 52.5% from the third quarter of 2021. Net income per ADS attributable to ordinary shareholders of the Company was RMB1.51 on a fully diluted basis.
Adjusted net income attributable to ordinary shareholders of the Company6 was RMB330 million, representing a decrease of 48.4% from the third quarter of 2021. Adjusted net income per ADS attributable to ordinary shareholders of the Company6 was RMB1.73 on a fully diluted basis.
__________________________
Active users refer to, for a specified period, users who made at least one transaction during that period through our platform or through our third-party partners’ platforms using credit line granted by us.
Originations of loans and outstanding principal balance represent the origination and outstanding principal balance of both on- and off-balance sheet loans.
Customer retention rate refers to the number of financial institution customers and partners who repurchase our service in the current quarter as a percentage of total number of financial institution customers and partners in the preceding quarter.
GMV refers to the total value of transactions completed for products purchased on our e-commerce and Maiya channel, net of returns.
Nominal APR refers to all-in interest costs and fees to the borrower over the net proceeds received by the borrower as a percentage of the total loan originations of both on- and off-balance sheet loans.
Adjusted net income attributable to ordinary shareholders of the Company, adjusted net income per ordinary share and per ADS attributable to ordinary shareholders of the Company are non-GAAP financial measures. For more information on non-GAAP financial measures, please see the section of “Use of Non-GAAP Financial Measures Statement” and the tables captioned “Unaudited Reconciliations of GAAP and Non-GAAP Results” set forth at the end of this press release.
Third Quarter 2022 Financial Results:
Operating revenue decreased by 9.4% from RMB2,969 million in the third quarter of 2021 to RMB2,690 million in the third quarter of 2022.
Revenue from new consumption-driven, location-based services increased by 31.3% from RMB400 million in the third quarter of 2021 to RMB525 million in the third quarter of 2022. The increase was primarily driven by the increase in transaction volume in the third quarter of 2022.
Revenue from technology-driven platform services decreased by 37.8% from RMB804 million in the third quarter of 2021 to RMB500 million in the third quarter of 2022. The decrease was primarily due to the decrease from profit-sharing model service within technology-driven platform services in the third quarter of 2022.
Revenue from credit-driven platform services decreased by 5.6% from RMB1,765 million in the third quarter of 2021 to RMB1,666 million in the third quarter of 2022. The decrease was primarily due to the decrease of loan facilitation and servicing fees-credit oriented and partially offset by the increase of interest and financial services income and other revenues and guarantee income.
Loan facilitation and servicing fees-credit oriented decreased by 39.8% from RMB1,187 million in the third quarter of 2021 to RMB714 million in the third quarter of 2022. The decrease was primarily due to the increase of guarantee obligation, which resulted in the decrease in considerations for revenue recognition.
Interest and financial services income and other revenues increased by 30.8% from RMB414 million in the third quarter of 2021 to RMB542 million in the third quarter of 2022. The increase was primarily driven by the increase in the origination of on-balance sheet loans in the third quarter of 2022.
Guarantee income increased by 149.8% from RMB164 million in the third quarter of 2021 to RMB410 million in the third quarter of 2022. The increase was primarily driven by the increase of loan origination and the increase of outstanding balances of the off-balance sheet loans funded by certain institutional funding partners, which are accounted for under ASC 460, Guarantees.
Cost of sales increased by 21.4% from RMB437 million in the third quarter of 2021 to RMB531 million in the third quarter of 2022, which was consistent with the increase of new consumption-driven revenue.
Funding cost increased by 41.1% from RMB106 million in the third quarter of 2021 to RMB150 million in the third quarter of 2022, which was consistent with the increase of the funding debts to fund the on-balance sheet loans.
Processing and servicing costs decreased by 9.8% from RMB524 million in the third quarter of 2021 to RMB472 million in the third quarter of 2022. This decrease was primarily driven by a decrease in fees to third party insurance companies and guarantee companies.
Provision for credit losses of financing and interest receivables decreased by 41.7% from RMB216 million in the third quarter of 2021 to RMB126 million in the third quarter of 2022. The credit losses have reflected the most recent performance in relation to the Company’s on-balance sheet loans and that the Company has continued to implement prudent credit assessment and risk management policies and procedures.
Provision for credit losses of contract assets and receivables was RMB133 million in the third quarter of 2022, as compared to RMB128 million in the third quarter of 2021.
Provision for credit losses of contingent liabilities of guarantee was RMB382 million in the third quarter of 2022, as compared to RMB51.4 million in the third quarter of 2021. The increase was primarily due to the increase of loan origination of the off-balance sheet loans funded by certain institutional funding partners, which are accounted for under ASC 460, Guarantees.
Gross profit decreased by 40.4% from RMB1,507 million in the third quarter of 2021 to RMB897 million in the third quarter of 2022.
Sales and marketing expenses decreased by 13.5% from RMB491 million in the third quarter of 2021 to RMB425 million in the third quarter of 2022. The decrease was primarily driven by a decrease in online advertising cost, partially offset by an increase in salaries and personnel related costs.
Research and development expenses was RMB141 million in the third quarter of 2022, as compared to RMB131 million in the third quarter of 2021.
General and administrative expenses was RMB104 million in the third quarter of 2022, as compared to RMB100 million in the third quarter of 2021.
Change in fair value of financial guarantee derivatives and loans at fair value was a gain of RMB122 million in the third quarter of 2022, as compared to a loss of RMB80.8 million in the third quarter of 2021. The change in fair value was primarily driven by the fair value gains realized as a result of the release of guarantee obligation, along with the decrease in the balances of the underlying outstanding off-balance sheet loans as of September 30, 2022.
Income tax expense decreased by 33.2% from RMB106 million in the third quarter of 2021 to RMB70.8 million in the third quarter of 2022. The decrease of the income tax expense was consistent with the decrease of the taxable income in the third quarter of 2022.
Net income decreased by 52.5% from RMB581 million in the third quarter of 2021 to RMB276 million in third quarter of 2022.
Update of Share Repurchase Program
Existing US$50 Million Share Repurchase Program
On March 16, 2022, the Company’s board of directors authorized a share repurchase program under which the Company could repurchase up to an aggregate of US$50 million of its shares/ADSs over the next twelve months. As of September 30, 2022, the Company had repurchased approximately 20 million ADSs for approximately US$44 million under this repurchase program.
Authorization of US$20 Million Share Repurchase Program
The Company’s board of directors authorized a new share repurchase program under which the Company could purchase up to an aggregate of US$20 million of its shares/ADSs over the next twelve months from November 17, 2022. Same as the existing share repurchase program, the repurchases under this new program may be made from time to time through open market transactions at prevailing market prices, in privately negotiated transactions, in block trades and/or through other legally permissible means, depending on the market conditions and in accordance with applicable rules and regulations. The timing and dollar amount of the repurchase transactions will be subject to the Securities and Exchange Commission Rule 10b-18 and/or Rule 10b5-1 requirements. The Company expects to continue to fund the repurchases under the share repurchase programs with its existing cash balance.
Conference Call
The Company’s management will host an earnings conference call at 8:30 PM U.S. Eastern time on November 16, 2022 (9:30 AM Beijing/Hong Kong time on November 17, 2022).
Participants who wish to join the conference call should register online at:
https://register.vevent.com/register/BI83536e70002548f3aa13d85629d1d3ba
Once registration is completed, each participant will receive the dial-in number and a unique access PIN for the conference call.
Participants joining the conference call should dial in at least 10 minutes before the scheduled start time.
A live and archived webcast of the conference call will be available on the Company’s investor relations website at http://ir.lexin.com.
About LexinFintech Holdings Ltd.
Lexin is a leading online and offline consumption platform and a technology-driven service provider in China. Established in 2013, the Company leverages its profound understanding of consumers in China and the valuable experience of partnering with hundreds of financial institutions over the years, as well as its advanced technological capabilities, to connect fast-growing new generation consumers and small and micro enterprise owners with well-established national and regional funding partners.
For more information, please visit http://ir.lexin.com.
To follow us on Twitter, please go to: https://twitter.com/LexinFintech.
Use of Non-GAAP Financial Measures Statement
In evaluating our business, we consider and use adjusted net income attributable to ordinary shareholders of the Company, non-GAAP EBIT, adjusted net income per ordinary share and per ADS attributable to ordinary shareholders of the Company, four non-GAAP measures, as supplemental measures to review and assess our operating performance. The presentation of the non-GAAP financial measures is not intended to be considered in isolation or as a substitute for the financial information prepared and presented in accordance with U.S. GAAP. We define adjusted net income attributable to ordinary shareholders of the Company as net income attributable to ordinary shareholders of the Company excluding share-based compensation expenses, interest expense associated with convertible notes, and investment (loss)/income and we define non-GAAP EBIT as net income excluding income tax expense, share-based compensation expenses, interest expense, net, and investment (loss)/income .
We present these non-GAAP financial measures because they are used by our management to evaluate our operating performance and formulate business plans. Adjusted net income attributable to ordinary shareholders of the Company enables our management to assess our operating results without considering the impact of share-based compensation expenses, interest expense associated with convertible notes, and investment (loss)/income. Non-GAAP EBIT, on the other hand, enables our management to assess our operating results without considering the impact of income tax expense, share-based compensation expenses, interest expense, net, and investment (loss)/income. We also believe that the use of these non-GAAP financial measures facilitates investors’ assessment of our operating performance. These non-GAAP financial measures are not defined under U.S. GAAP and are not presented in accordance with U.S. GAAP.
These non-GAAP financial measures have limitations as an analytical tool. One of the key limitations of using adjusted net income attributable to ordinary shareholders of the Company and non-GAAP EBIT is that they do not reflect all items of income and expense that affect our operations. Share-based compensation expenses, interest expense associated with convertible notes, income tax expense, interest expense, net, and investment (loss)/income have been and may continue to be incurred in our business and are not reflected in the presentation of adjusted net income attributable to ordinary shareholders of the Company and non-GAAP EBIT. Further, these non-GAAP financial measures may differ from the non-GAAP financial information used by other companies, including peer companies, and therefore their comparability may be limited.
We compensate for these limitations by reconciling each of the non-GAAP financial measures to the most directly comparable U.S. GAAP financial measure, which should be considered when evaluating our performance. We encourage you to review our financial information in its entirety and not rely on a single financial measure.
Exchange Rate Information Statement
This announcement contains translations of certain RMB amounts into U.S. dollars (“US$”) at specified rates solely for the convenience of the reader. Unless otherwise stated, all translations from RMB to US$ were made at the rate of RMB7.1135 to US$1.00, the exchange rate set forth in the H.10 statistical release of the Federal Reserve Board on September 30, 2022. The Company makes no representation that the RMB or US$ amounts referred could be converted into US$ or RMB, as the case may be, at any particular rate or at all.
Safe Harbor Statement
This announcement contains forward-looking statements. These statements are made under the “safe harbor” provisions of the U.S. Private Securities Litigation Reform Act of 1995. Statements that are not historical facts, including statements about Lexin’s beliefs and expectations, are forward-looking statements. These forward-looking statements can be identified by terminology such as “will,” “expects,” “anticipates,” “future,” “intends,” “plans,” “believes,” “estimates,” “confident” and similar statements. Among other things, the expectation of its collection efficiency and delinquency, business outlook and quotations from management in this announcement, contain forward-looking statements. Lexin may also make written or oral forward-looking statements in its periodic reports to the U.S. Securities and Exchange Commission (the “SEC”), in its annual report to shareholders, in press releases and other written materials and in oral statements made by its officers, directors or employees to third parties. Forward-looking statements involve inherent risks and uncertainties. A number of factors could cause actual results to differ materially from those contained in any forward-looking statement, including but not limited to the following: Lexin’s goal and strategies; Lexin’s expansion plans; Lexin’s future business development, financial condition and results of operations; Lexin’s expectation regarding demand for, and market acceptance of, its credit and investment management products; Lexin’s expectations regarding keeping and strengthening its relationship with borrowers, institutional funding partners, merchandise suppliers and other parties it collaborates with; general economic and business conditions; and assumptions underlying or related to any of the foregoing. Further information regarding these and other risks is included in Lexin’s filings with the SEC. All information provided in this press release and in the attachments is as of the date of this press release, and Lexin does not undertake any obligation to update any forward-looking statement, except as required under applicable law.
For investor and media inquiries, please contact:
LexinFintech Holdings Ltd.
IR inquiries:
Echo Yan
Tel: +86 (755) 3637-8888 ext. 6258
E-mail: echoyan@lexin.com
Media inquiries:
Limin Chen
Tel: +86 (755) 3637-8888 ext. 6993
E-mail: liminchen@lexin.com
SOURCE LexinFintech Holdings Ltd.
LexinFintech Holdings Ltd.
Unaudited Condensed Consolidated Balance Sheets
| As of |
| |||||||
(In thousands) | December 31, 2021 |
| September 30, 2022 |
| |||||
| RMB |
| RMB |
| US$ |
| |||
ASSETS |
|
|
|
|
|
| |||
Current assets |
|
|
|
|
|
| |||
Cash and cash equivalents |
| 2,664,132 |
|
| 2,108,511 |
|
| 296,410 |
|
Restricted cash |
| 1,305,435 |
|
| 1,236,978 |
|
| 173,892 |
|
Restricted time deposits |
| 1,745,898 |
|
| 1,321,762 |
|
| 185,810 |
|
Short-term financing receivables, net of allowance for credit losses of RMB307,341 and RMB181,612 as of December 31, 2021 and September 30, 2022, respectively |
| 3,772,975 |
|
| 6,119,987 |
|
| 860,334 |
|
Loans at fair value |
| 252,970 |
|
| 295,527 |
|
| 41,545 |
|
Accrued interest receivable, net of allowance for credit losses of RMB1,367 and RMB2,033 as of December 31, 2021 and September 30, 2022, respectively |
| 53,513 |
|
| 91,619 |
|
| 12,880 |
|
Prepaid expenses and other current assets |
| 941,150 |
|
| 874,057 |
|
| 122,873 |
|
Amounts due from related parties |
| 6,337 |
|
| 7,257 |
|
| 1,020 |
|
Deposits to insurance companies and guarantee companies |
| 1,378,489 |
|
| 1,976,331 |
|
| 277,828 |
|
Short-term guarantee receivables, net of allowance for credit losses of RMB21,006 and RMB42,128 as of December 31, 2021 and September 30, 2022, respectively |
| 543,949 |
|
| 810,503 |
|
| 113,939 |
|
Short-term contract assets and service fees receivable, net of allowance for credit losses of RMB187,261 and RMB141,631 as of December 31, 2021 and September 30, 2022, respectively |
| 3,942,700 |
|
| 2,855,505 |
|
| 401,421 |
|
Inventories, net |
| 47,816 |
|
| 86,736 |
|
| 12,193 |
|
Total current assets |
| 16,655,364 |
|
| 17,784,773 |
|
| 2,500,145 |
|
Non‑current assets |
|
|
|
|
|
| |||
Restricted cash |
| 149,247 |
|
| 173,278 |
|
| 24,359 |
|
Long‑term financing receivables, net of allowance for credit losses of RMB19,523 and RMB13,436 as of December 31, 2021 and September 30, 2022, respectively |
| 241,127 |
|
| 450,945 |
|
| 63,393 |
|
Long-term guarantee receivables, net of allowance for credit losses of RMB4,061 and RMB9,384 as of December 31, 2021 and September 30, 2022, respectively |
| 101,562 |
|
| 177,387 |
|
| 24,937 |
|
Long-term contract assets and service fees receivable, net of allowance for credit losses of RMB34,973 and RMB31,025 as of December 31, 2021 and September 30, 2022, respectively |
| 244,672 |
|
| 315,070 |
|
| 44,292 |
|
Property, equipment and software, net |
| 195,330 |
|
| 242,672 |
|
| 34,114 |
|
Land use rights, net |
| 966,067 |
|
| 940,267 |
|
| 132,181 |
|
Long‑term investments |
| 469,064 |
|
| 472,407 |
|
| 66,410 |
|
Deferred tax assets |
| 1,176,878 |
|
| 1,252,169 |
|
| 176,027 |
|
Other assets |
| 826,883 |
|
| 989,457 |
|
| 139,096 |
|
Total non‑current assets |
| 4,370,830 |
|
| 5,013,652 |
|
| 704,809 |
|
TOTAL ASSETS |
| 21,026,194 |
|
| 22,798,425 |
|
| 3,204,954 |
|
|
|
|
|
|
|
| |||
LIABILITIES |
|
|
|
|
|
| |||
Current liabilities |
|
|
|
|
|
| |||
Accounts payable |
| 15,705 |
|
| 33,438 |
|
| 4,701 |
|
Amounts due to related parties |
| 23,102 |
|
| 3,802 |
|
| 534 |
|
Short‑term borrowings |
| 1,799,741 |
|
| 1,245,682 |
|
| 175,115 |
|
Short‑term funding debts |
| 3,101,381 |
|
| 3,908,918 |
|
| 549,507 |
|
Accrued interest payable |
| 24,851 |
|
| 1,148 |
|
| 161 |
|
Deferred guarantee income |
| 419,843 |
|
| 753,440 |
|
| 105,917 |
|
Contingent guarantee liabilities |
| 928,840 |
|
| 838,250 |
|
| 117,839 |
|
Accrued expenses and other current liabilities |
| 3,873,657 |
|
| 3,225,570 |
|
| 453,443 |
|
Convertible loans |
| - |
|
| 2,101,816 |
|
| 295,469 |
|
Total current liabilities |
| 10,187,120 |
|
| 12,112,064 |
|
| 1,702,686 |
|
Non‑current liabilities |
|
|
|
|
|
| |||
Long‑term funding debts |
| 696,852 |
|
| 2,065,671 |
|
| 290,387 |
|
Deferred tax liabilities |
| 54,335 |
|
| 48,168 |
|
| 6,771 |
|
Long term borrowings |
| - |
|
| 102,700 |
|
| 14,437 |
|
Convertible notes |
| 1,882,689 |
|
| - |
|
| - |
|
Other long-term liabilities |
| 137,389 |
|
| 112,179 |
|
| 15,770 |
|
Total non‑current liabilities |
| 2,771,265 |
|
| 2,328,718 |
|
| 327,365 |
|
TOTAL LIABILITIES |
| 12,958,385 |
|
| 14,440,782 |
|
| 2,030,051 |
|
SHAREHOLDERS’ EQUITY: |
|
|
|
|
|
| |||
Class A Ordinary Shares |
| 180 |
|
| 190 |
|
| 29 |
|
Class B Ordinary Shares |
| 57 |
|
| 47 |
|
| 8 |
|
Treasury stock |
| - |
|
| (309,217 | ) |
| (43,469 | ) |
Additional paid‑in capital |
| 2,918,993 |
|
| 3,043,828 |
|
| 427,895 |
|
Statutory reserves |
| 901,322 |
|
| 901,322 |
|
| 126,706 |
|
Accumulated other comprehensive income |
| 11,273 |
|
| (33,504 | ) |
| (4,710 | ) |
Retained earnings |
| 4,195,791 |
|
| 4,714,127 |
|
| 662,701 |
|
Non-controlling interests |
| 40,193 |
|
| 40,850 |
|
| 5,743 |
|
TOTAL SHAREHOLDERS’ EQUITY |
| 8,067,809 |
|
| 8,357,643 |
|
| 1,174,903 |
|
TOTAL LIABILITIES AND SHAREHOLDERS’ EQUITY |
| 21,026,194 |
|
| 22,798,425 |
|
| 3,204,954 |
|
|
|
|
|
|
|
|
|
|
|
LexinFintech Holdings Ltd.
Unaudited Condensed Consolidated Statements of Operations
| For the Three Months Ended September 30, |
|
| For the Nine Months Ended September 30, |
| ||||||||||||||
(In thousands, except for share and per share data) | 2021 |
| 2022 |
|
| 2021 |
| 2022 |
| ||||||||||
| RMB |
| RMB |
| US$ |
|
| RMB |
| RMB |
| US$ |
| ||||||
Operating revenue: |
|
|
|
|
|
|
|
|
|
|
|
|
| ||||||
New Consumption-Driven, Location-Based Services (1) |
| 399,754 |
|
| 524,986 |
|
| 73,801 |
|
|
| 1,238,740 |
|
| 1,382,071 |
|
| 194,288 |
|
Technology-Driven Platform Services (1) |
| 803,737 |
|
| 499,699 |
|
| 70,247 |
|
|
| 2,132,071 |
|
| 1,433,174 |
|
| 201,472 |
|
Credit-Driven Platform Services (1) |
| 1,765,304 |
|
| 1,665,652 |
|
| 234,154 |
|
|
| 5,810,503 |
|
| 4,000,300 |
|
| 562,353 |
|
Loan facilitation and servicing fees- credit oriented (1) |
| 1,187,060 |
|
| 714,102 |
|
| 100,387 |
|
|
| 3,842,315 |
|
| 1,637,287 |
|
| 230,166 |
|
Interest and financial services income and other revenues (1) |
| 414,192 |
|
| 541,708 |
|
| 76,152 |
|
|
| 1,365,492 |
|
| 1,409,495 |
|
| 198,144 |
|
Guarantee income (1) |
| 164,052 |
|
| 409,842 |
|
| 57,615 |
|
|
| 602,696 |
|
| 953,518 |
|
| 134,043 |
|
Total operating revenue |
| 2,968,795 |
|
| 2,690,337 |
|
| 378,202 |
|
|
| 9,181,314 |
|
| 6,815,545 |
|
| 958,113 |
|
Operating cost: |
|
|
|
|
|
|
|
|
|
|
|
|
| ||||||
Cost of sales |
| (436,973 | ) |
| (530,685 | ) |
| (74,603 | ) |
|
| (1,297,433 | ) |
| (1,410,265 | ) |
| (198,252 | ) |
Funding cost |
| (106,013 | ) |
| (149,545 | ) |
| (21,023 | ) |
|
| (359,393 | ) |
| (371,694 | ) |
| (52,252 | ) |
Processing and servicing cost |
| (523,611 | ) |
| (472,261 | ) |
| (66,389 | ) |
|
| (1,390,244 | ) |
| (1,408,357 | ) |
| (197,984 | ) |
Provision for credit losses of financing and interest receivables |
| (216,344 | ) |
| (126,214 | ) |
| (17,743 | ) |
|
| (499,977 | ) |
| (290,962 | ) |
| (40,903 | ) |
Provision for credit losses of contract assets and receivables |
| (127,958 | ) |
| (132,678 | ) |
| (18,652 | ) |
|
| (486,593 | ) |
| (333,896 | ) |
| (46,938 | ) |
Provision for credit losses of contingent liabilities of guarantee |
| (51,374 | ) |
| (381,697 | ) |
| (53,658 | ) |
|
| (610,658 | ) |
| (1,009,013 | ) |
| (141,845 | ) |
Total operating cost |
| (1,462,273 | ) |
| (1,793,080 | ) |
| (252,068 | ) |
|
| (4,644,298 | ) |
| (4,824,187 | ) |
| (678,174 | ) |
Gross profit |
| 1,506,522 |
|
| 897,257 |
|
| 126,134 |
|
|
| 4,537,016 |
|
| 1,991,358 |
|
| 279,939 |
|
Operating expenses: |
|
|
|
|
|
|
|
|
|
|
|
|
| ||||||
Sales and marketing expenses |
| (490,934 | ) |
| (424,544 | ) |
| (59,681 | ) |
|
| (1,331,252 | ) |
| (1,262,441 | ) |
| (177,471 | ) |
Research and development expenses |
| (130,996 | ) |
| (140,560 | ) |
| (19,760 | ) |
|
| (385,650 | ) |
| (447,595 | ) |
| (62,922 | ) |
General and administrative expenses |
| (100,463 | ) |
| (104,389 | ) |
| (14,675 | ) |
|
| (352,413 | ) |
| (334,513 | ) |
| (47,025 | ) |
Total operating expenses |
| (722,393 | ) |
| (669,493 | ) |
| (94,116 | ) |
|
| (2,069,315 | ) |
| (2,044,549 | ) |
| (287,418 | ) |
Change in fair value of financial guarantee derivatives and loans at fair value |
| (80,755 | ) |
| 121,776 |
|
| 17,119 |
|
|
| (6,356 | ) |
| 689,196 |
|
| 96,886 |
|
Interest expense, net |
| (14,023 | ) |
| (16,202 | ) |
| (2,278 | ) |
|
| (50,373 | ) |
| (47,449 | ) |
| (6,670 | ) |
Investment (loss)/ income |
| (1,656 | ) |
| (3,027 | ) |
| (426 | ) |
|
| (4,053 | ) |
| 4,479 |
|
| 630 |
|
Other, net |
| (946 | ) |
| 16,210 |
|
| 2,279 |
|
|
| 59,889 |
|
| 61,929 |
|
| 8,706 |
|
Income before income tax expense |
| 686,749 |
|
| 346,521 |
|
| 48,712 |
|
|
| 2,466,808 |
|
| 654,964 |
|
| 92,073 |
|
Income tax expense |
| (105,987 | ) |
| (70,828 | ) |
| (9,957 | ) |
|
| (388,303 | ) |
| (130,338 | ) |
| (18,323 | ) |
Net income |
| 580,762 |
|
| 275,693 |
|
| 38,755 |
|
|
| 2,078,505 |
|
| 524,626 |
|
| 73,750 |
|
Less: net income attributable to non-controlling interests |
| 279 |
|
| 231 |
|
| 32 |
|
|
| 326 |
|
| 6,290 |
|
| 884 |
|
Net income attributable to ordinary shareholders of the Company |
| 580,483 |
|
| 275,462 |
|
| 38,723 |
|
|
| 2,078,179 |
|
| 518,336 |
|
| 72,866 |
|
|
|
|
|
|
|
|
|
|
|
|
|
|
| ||||||
Net income per ordinary share attributable to ordinary shareholders of the Company |
|
|
|
|
|
|
|
|
|
|
|
|
| ||||||
Basic |
| 1.57 |
|
| 0.82 |
|
| 0.11 |
|
|
| 5.64 |
|
| 1.49 |
|
| 0.21 |
|
Diluted |
| 1.43 |
|
| 0.75 |
|
| 0.11 |
|
|
| 5.08 |
|
| 1.40 |
|
| 0.20 |
|
|
|
|
|
|
|
|
|
|
|
|
|
|
| ||||||
Net income per ADS attributable to ordinary shareholders of the Company |
|
|
|
|
|
|
|
|
|
|
|
|
| ||||||
Basic |
| 3.15 |
|
| 1.64 |
|
| 0.23 |
|
|
| 11.28 |
|
| 2.97 |
|
| 0.42 |
|
Diluted |
| 2.86 |
|
| 1.51 |
|
| 0.21 |
|
|
| 10.17 |
|
| 2.81 |
|
| 0.39 |
|
|
|
|
|
|
|
|
|
|
|
|
|
|
| ||||||
Weighted average ordinary shares outstanding |
|
|
|
|
|
|
|
|
|
|
|
|
| ||||||
Basic |
| 368,873,003 |
|
| 336,900,544 |
|
| 336,900,544 |
|
|
| 368,375,020 |
|
| 348,868,793 |
|
| 348,868,793 |
|
Diluted |
| 414,206,884 |
|
| 381,524,186 |
|
| 381,524,186 |
|
|
| 415,500,045 |
|
| 393,605,236 |
|
| 393,605,236 |
|
__________________________
(1) Starting from the first quarter of 2022, we report our revenue streams in three categories - new consumption-driven, location-based services, technology-driven platform services, and credit-driven platform services, to provide more relevant and updated information. We also revised the revenue presentation in comparative periods to conform to the current classification.
In providing new consumption-driven, location-based services, we provide platform and services for merchants, shopping malls, and brands to conduct sales and marketing, with the goal to drive transaction volume, for which we charge a service fee. Revenue earned from the online direct sales and services is recognized under new consumption-driven, location-based services, which was previously reported as “Online direct sales” and “Other services” within “Online direct sales and services income” before the change of presentation.
In providing technology-driven platform services, we offer a comprehensive set of services to our customers that enable them to increase revenues, manage financial risks, improve operating efficiency, improve service quality, enhance collections, and reduce overall costs. Revenue earned from platform-based services, membership services and other services is reported as one combined financial statement line item under “Technology-driven platform services.” The membership fees and other services revenue were previously reported as “Membership services” and “Other services” within “Online direct sales and services income” before the change of presentation.
The revenue earned from credit-oriented services is recognized under credit-driven platform services, which includes “Loan facilitation and servicing fees-credit oriented,” “Interest and financial services income and other revenues,” and “Guarantee income.”
LexinFintech Holdings Ltd.
Unaudited Condensed Consolidated Statements of Comprehensive Income
| For the Three Months Ended September 30, |
|
| For the Nine Months Ended September 30, |
| ||||||||||||||
(In thousands) | 2021 |
| 2022 |
|
| 2021 |
| 2022 |
| ||||||||||
| RMB |
| RMB |
| US$ |
|
| RMB |
| RMB |
| US$ |
| ||||||
Net income |
| 580,762 |
|
| 275,693 |
|
| 38,755 |
|
|
| 2,078,505 |
|
| 524,626 |
|
| 73,750 |
|
Other comprehensive income |
|
|
|
|
|
|
|
|
|
|
|
|
| ||||||
Foreign currency translation adjustment, net of nil tax |
| (936 | ) |
| (25,170 | ) |
| (3,538 | ) |
|
| 2,297 |
|
| (44,777 | ) |
| (6,295 | ) |
Total comprehensive income |
| 579,826 |
|
| 250,523 |
|
| 35,217 |
|
|
| 2,080,802 |
|
| 479,849 |
|
| 67,455 |
|
Less: net income attributable to non-controlling interests |
| 279 |
|
| 231 |
|
| 32 |
|
|
| 326 |
|
| 6,290 |
|
| 884 |
|
Total comprehensive income attributable to ordinary shareholders of the Company |
| 579,547 |
|
| 250,292 |
|
| 35,185 |
|
|
| 2,080,476 |
|
| 473,559 |
|
| 66,571 |
|
|
|
|
|
|
|
|
|
|
|
|
|
|
|
|
|
|
|
|
|
LexinFintech Holdings Ltd.
Unaudited Reconciliations of GAAP and Non-GAAP Results
| For the Three Months Ended September 30, |
|
| For the Nine Months Ended September 30, |
| ||||||||||||||
(In thousands, except for share and per share data) | 2021 |
| 2022 |
|
| 2021 |
| 2022 |
| ||||||||||
| RMB |
| RMB |
| US$ |
|
| RMB |
| RMB |
| US$ |
| ||||||
Reconciliation of Adjusted net income attributable to ordinary shareholders of the Company to Net income attributable to ordinary shareholders of the Company |
|
|
|
|
|
|
|
|
|
|
|
|
| ||||||
Net income attributable to ordinary shareholders of the Company |
| 580,483 |
|
| 275,462 |
|
| 38,723 |
|
|
| 2,078,179 |
|
| 518,336 |
|
| 72,866 |
|
Add: Share-based compensation expenses |
| 47,363 |
|
| 39,963 |
|
| 5,618 |
|
|
| 139,845 |
|
| 119,781 |
|
| 16,839 |
|
Interest expense associated with convertible notes |
| 11,375 |
|
| 12,044 |
|
| 1,693 |
|
|
| 33,675 |
|
| 34,454 |
|
| 4,843 |
|
Investment loss/(income) |
| 1,656 |
|
| 3,027 |
|
| 426 |
|
|
| 4,053 |
|
| (4,479 | ) |
| (630 | ) |
Tax effects on Non-GAAP adjustments (2) |
| - |
|
| - |
|
| - |
|
|
| 7,151 |
|
| - |
|
| - |
|
Adjusted net income attributable to ordinary shareholders of the Company |
| 640,877 |
|
| 330,496 |
|
| 46,460 |
|
|
| 2,262,903 |
|
| 668,092 |
|
| 93,918 |
|
|
|
|
|
|
|
|
|
|
|
|
|
|
| ||||||
Adjusted net income per ordinary share attributable to ordinary shareholders of the Company |
|
|
|
|
|
|
|
|
|
|
|
|
| ||||||
Basic |
| 1.74 |
|
| 0.98 |
|
| 0.14 |
|
|
| 6.14 |
|
| 1.92 |
|
| 0.27 |
|
Diluted |
| 1.55 |
|
| 0.87 |
|
| 0.12 |
|
|
| 5.45 |
|
| 1.70 |
|
| 0.24 |
|
|
|
|
|
|
|
|
|
|
|
|
|
|
| ||||||
Adjusted net income per ADS attributable to ordinary shareholders of the Company |
|
|
|
|
|
|
|
|
|
|
|
|
| ||||||
Basic |
| 3.47 |
|
| 1.96 |
|
| 0.28 |
|
|
| 12.29 |
|
| 3.83 |
|
| 0.54 |
|
Diluted |
| 3.09 |
|
| 1.73 |
|
| 0.24 |
|
|
| 10.89 |
|
| 3.39 |
|
| 0.48 |
|
|
|
|
|
|
|
|
|
|
|
|
|
|
| ||||||
Weighted average number of ordinary shares outstanding attributable to ordinary shareholders of the Company |
|
|
|
|
|
|
|
|
|
|
|
|
| ||||||
Basic |
| 368,873,003 |
|
| 336,900,544 |
|
| 336,900,544 |
|
|
| 368,375,020 |
|
| 348,868,793 |
|
| 348,868,793 |
|
Diluted |
| 414,206,884 |
|
| 381,524,186 |
|
| 381,524,186 |
|
|
| 415,500,045 |
|
| 393,605,236 |
|
| 393,605,236 |
|
__________________________
(2) To exclude the tax effects related to the investment loss/(income)
LexinFintech Holdings Ltd.
Unaudited Reconciliations of GAAP and Non-GAAP Results
| For the Three Months Ended September 30, |
|
| For the Nine Months Ended September 30, |
| ||||||||||||||
(In thousands) | 2021 |
| 2022 |
|
| 2021 |
| 2022 |
| ||||||||||
| RMB |
| RMB |
| US$ |
|
| RMB |
| RMB |
| US$ |
| ||||||
Reconciliations of Non-GAAP EBIT to Net income |
|
|
|
|
|
|
|
|
|
|
|
|
| ||||||
Net income |
| 580,762 |
|
| 275,693 |
|
| 38,755 |
|
|
| 2,078,505 |
|
| 524,626 |
|
| 73,750 |
|
Add: Income tax expense |
| 105,987 |
|
| 70,828 |
|
| 9,957 |
|
|
| 388,303 |
|
| 130,338 |
|
| 18,323 |
|
Share-based compensation expenses |
| 47,363 |
|
| 39,963 |
|
| 5,618 |
|
|
| 139,845 |
|
| 119,781 |
|
| 16,839 |
|
Interest expense, net |
| 14,023 |
|
| 16,202 |
|
| 2,278 |
|
|
| 50,373 |
|
| 47,449 |
|
| 6,670 |
|
Investment loss/(income) |
| 1,656 |
|
| 3,027 |
|
| 426 |
|
|
| 4,053 |
|
| (4,479 | ) |
| (630 | ) |
Non-GAAP EBIT |
| 749,791 |
|
| 405,713 |
|
| 57,034 |
|
|
| 2,661,079 |
|
| 817,715 |
|
| 114,952 |
|
|
|
|
|
|
|
|
|
|
|
|
|
|
|
|
|
|
|
|
|
Additional Credit Information
Vintage Charge Off Curve
Dpd30+/GMV by Performance Windows
First Payment Default 30+