
 Yahoo Finance
 What Can We Learn From Fortis Inc.’s (TSE:FTS) Investment Returns?

Today we'll evaluate Fortis Inc. (TSE:FTS) to determine whether it could have potential as an investment idea. Specifically, we're going to calculate its Return On Capital Employed (ROCE), in the hopes of getting some insight into the business.
Firstly, we'll go over how we calculate ROCE. Next, we'll compare it to others in its industry. And finally, we'll look at how its current liabilities are impacting its ROCE.
What is Return On Capital Employed (ROCE)?
ROCE is a measure of a company's yearly pre-tax profit (its return), relative to the capital employed in the business. Generally speaking a higher ROCE is better. Overall, it is a valuable metric that has its flaws. Renowned investment researcher Michael Mauboussin has suggested that a high ROCE can indicate that 'one dollar invested in the company generates value of more than one dollar'.
How Do You Calculate Return On Capital Employed?
The formula for calculating the return on capital employed is:
Return on Capital Employed = Earnings Before Interest and Tax (EBIT) ÷ (Total Assets - Current Liabilities)
Or for Fortis:
0.049 = CA$2.4b ÷ (CA$52b - CA$3.4b) (Based on the trailing twelve months to June 2019.)
So, Fortis has an ROCE of 4.9%.
Check out our latest analysis for Fortis
Is Fortis's ROCE Good?
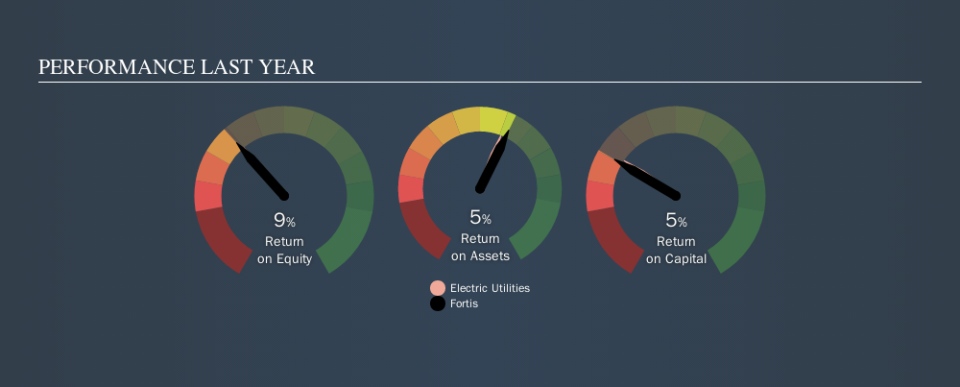
One way to assess ROCE is to compare similar companies. It appears that Fortis's ROCE is fairly close to the Electric Utilities industry average of 4.9%. Independently of how Fortis compares to its industry, its ROCE in absolute terms is low; especially compared to the ~1.9% available in government bonds. It is likely that there are more attractive prospects out there.
The image below shows how Fortis's ROCE compares to its industry, and you can click it to see more detail on its past growth.
When considering ROCE, bear in mind that it reflects the past and does not necessarily predict the future. ROCE can be misleading for companies in cyclical industries, with returns looking impressive during the boom times, but very weak during the busts. This is because ROCE only looks at one year, instead of considering returns across a whole cycle. Since the future is so important for investors, you should check out our free report on analyst forecasts for Fortis.
How Fortis's Current Liabilities Impact Its ROCE
Current liabilities are short term bills and invoices that need to be paid in 12 months or less. Due to the way the ROCE equation works, having large bills due in the near term can make it look as though a company has less capital employed, and thus a higher ROCE than usual. To counteract this, we check if a company has high current liabilities, relative to its total assets.
Fortis has total assets of CA$52b and current liabilities of CA$3.4b. As a result, its current liabilities are equal to approximately 6.6% of its total assets. Fortis has very few current liabilities, which have a minimal effect on its already low ROCE.
What We Can Learn From Fortis's ROCE
Nevertheless, there are potentially more attractive companies to invest in. You might be able to find a better investment than Fortis. If you want a selection of possible winners, check out this free list of interesting companies that trade on a P/E below 20 (but have proven they can grow earnings).
I will like Fortis better if I see some big insider buys. While we wait, check out this free list of growing companies with considerable, recent, insider buying.
We aim to bring you long-term focused research analysis driven by fundamental data. Note that our analysis may not factor in the latest price-sensitive company announcements or qualitative material.
If you spot an error that warrants correction, please contact the editor at editorial-team@simplywallst.com. This article by Simply Wall St is general in nature. It does not constitute a recommendation to buy or sell any stock, and does not take account of your objectives, or your financial situation. Simply Wall St has no position in the stocks mentioned. Thank you for reading.
