
 Yahoo Finance
 All You Need To Know About Schneider Electric S.E.'s (EPA:SU) Financial Health

Investors looking for stocks with high market liquidity and little debt on the balance sheet should consider Schneider Electric S.E. (EPA:SU). With a market valuation of €42b, SU is a safe haven in times of market uncertainty due to its strong balance sheet. In times of low liquidity in the market, these firms won’t be left high and dry. They are also relatively unaffected by increases in interest rates. Today I will analyse the latest financial data for SU to determine is solvency and liquidity and whether the stock is a sound investment.
See our latest analysis for Schneider Electric
SU’s Debt (And Cash Flows)
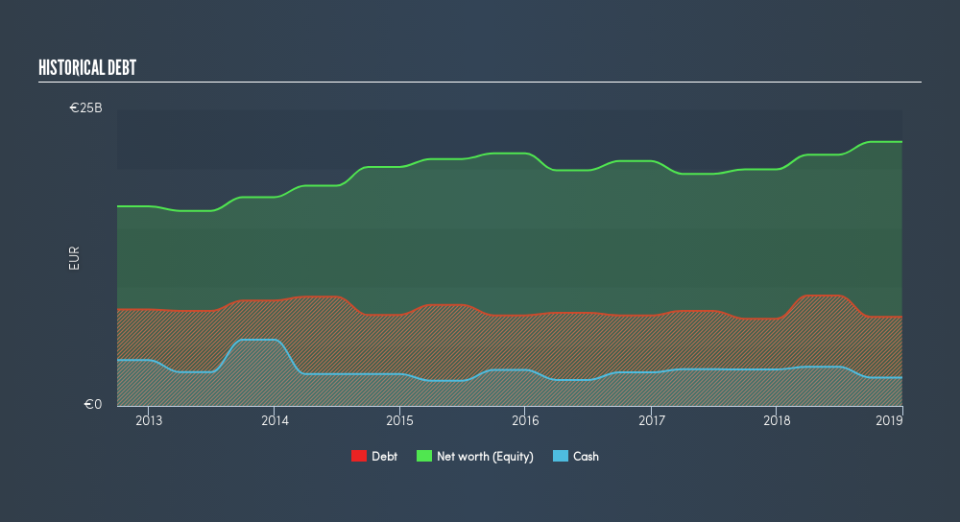
SU's debt level has been constant at around €7.5b over the previous year – this includes long-term debt. At this stable level of debt, SU's cash and short-term investments stands at €2.4b , ready to be used for running the business. Additionally, SU has generated cash from operations of €2.9b in the last twelve months, resulting in an operating cash to total debt ratio of 38%, indicating that SU’s current level of operating cash is high enough to cover debt.
Can SU meet its short-term obligations with the cash in hand?
At the current liabilities level of €10b, it appears that the company has been able to meet these commitments with a current assets level of €13b, leading to a 1.31x current account ratio. The current ratio is calculated by dividing current assets by current liabilities. For Electrical companies, this ratio is within a sensible range since there's a sufficient cash cushion without leaving too much capital idle or in low-earning investments.
Does SU face the risk of succumbing to its debt-load?
SU’s level of debt is appropriate relative to its total equity, at 34%. This range is considered safe as SU is not taking on too much debt obligation, which may be constraining for future growth. We can test if SU’s debt levels are sustainable by measuring interest payments against earnings of a company. Net interest should be covered by earnings before interest and tax (EBIT) by at least three times to be safe. In SU's case, the ratio of 20.12x suggests that interest is comfortably covered. Large-cap investments like SU are often believed to be a safe investment due to their ability to pump out ample earnings multiple times its interest payments.
Next Steps:
SU’s debt level is appropriate for a company its size, and it is also able to generate sufficient cash flow coverage, meaning it has been able to put its debt in good use. Furthermore, the company exhibits an ability to meet its near-term obligations, which isn't a big surprise for a large-cap. Keep in mind I haven't considered other factors such as how SU has been performing in the past. You should continue to research Schneider Electric to get a better picture of the stock by looking at:
Future Outlook: What are well-informed industry analysts predicting for SU’s future growth? Take a look at our free research report of analyst consensus for SU’s outlook.
Valuation: What is SU worth today? Is the stock undervalued, even when its growth outlook is factored into its intrinsic value? The intrinsic value infographic in our free research report helps visualize whether SU is currently mispriced by the market.
Other High-Performing Stocks: Are there other stocks that provide better prospects with proven track records? Explore our free list of these great stocks here.
We aim to bring you long-term focused research analysis driven by fundamental data. Note that our analysis may not factor in the latest price-sensitive company announcements or qualitative material.
If you spot an error that warrants correction, please contact the editor at editorial-team@simplywallst.com. This article by Simply Wall St is general in nature. It does not constitute a recommendation to buy or sell any stock, and does not take account of your objectives, or your financial situation. Simply Wall St has no position in the stocks mentioned. Thank you for reading.
