
 Yahoo Finance
 Do You Know What Parex Resources Inc.'s (TSE:PXT) P/E Ratio Means?

This article is written for those who want to get better at using price to earnings ratios (P/E ratios). We'll apply a basic P/E ratio analysis to Parex Resources Inc.'s (TSE:PXT), to help you decide if the stock is worth further research. Looking at earnings over the last twelve months, Parex Resources has a P/E ratio of 6.57. That means that at current prices, buyers pay CA$6.57 for every CA$1 in trailing yearly profits.
See our latest analysis for Parex Resources
How Do I Calculate A Price To Earnings Ratio?
The formula for price to earnings is:
Price to Earnings Ratio = Price per Share (in the reporting currency) ÷ Earnings per Share (EPS)
Or for Parex Resources:
P/E of 6.57 = $17.04 (Note: this is the share price in the reporting currency, namely, USD ) ÷ $2.59 (Based on the trailing twelve months to December 2018.)
Is A High P/E Ratio Good?
A higher P/E ratio means that buyers have to pay a higher price for each CA$1 the company has earned over the last year. That isn't a good or a bad thing on its own, but a high P/E means that buyers have a higher opinion of the business's prospects, relative to stocks with a lower P/E.
How Growth Rates Impact P/E Ratios
Earnings growth rates have a big influence on P/E ratios. If earnings are growing quickly, then the 'E' in the equation will increase faster than it would otherwise. And in that case, the P/E ratio itself will drop rather quickly. And as that P/E ratio drops, the company will look cheap, unless its share price increases.
Parex Resources's 158% EPS improvement over the last year was like bamboo growth after rain; rapid and impressive. The sweetener is that the annual five year growth rate of 40% is also impressive. So I'd be surprised if the P/E ratio was not above average.
How Does Parex Resources's P/E Ratio Compare To Its Peers?
One good way to get a quick read on what market participants expect of a company is to look at its P/E ratio. We can see in the image below that the average P/E (16.4) for companies in the oil and gas industry is higher than Parex Resources's P/E.
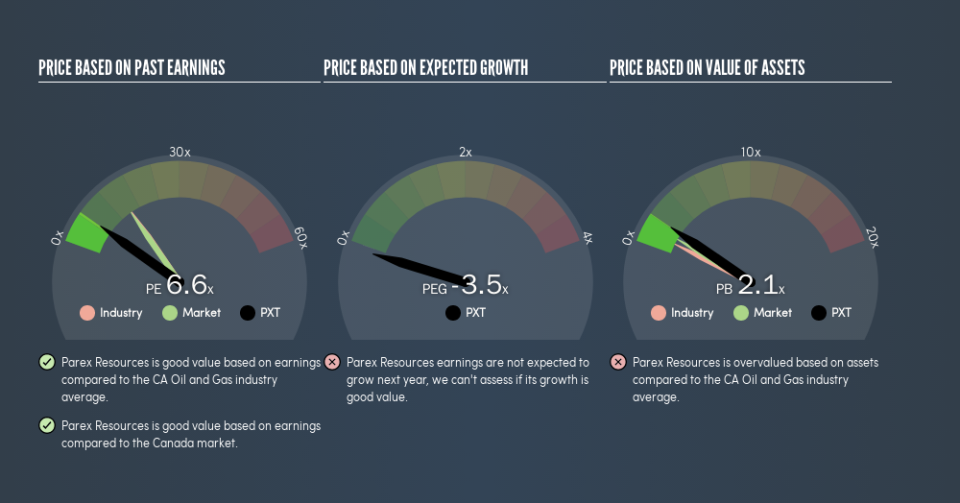
Its relatively low P/E ratio indicates that Parex Resources shareholders think it will struggle to do as well as other companies in its industry classification. Since the market seems unimpressed with Parex Resources, it's quite possible it could surprise on the upside. It is arguably worth checking if insiders are buying shares, because that might imply they believe the stock is undervalued.
Don't Forget: The P/E Does Not Account For Debt or Bank Deposits
Don't forget that the P/E ratio considers market capitalization. So it won't reflect the advantage of cash, or disadvantage of debt. Theoretically, a business can improve its earnings (and produce a lower P/E in the future) by investing in growth. That means taking on debt (or spending its cash).
Such expenditure might be good or bad, in the long term, but the point here is that the balance sheet is not reflected by this ratio.
Parex Resources's Balance Sheet
With net cash of US$463m, Parex Resources has a very strong balance sheet, which may be important for its business. Having said that, at 18% of its market capitalization the cash hoard would contribute towards a higher P/E ratio.
The Verdict On Parex Resources's P/E Ratio
Parex Resources has a P/E of 6.6. That's below the average in the CA market, which is 15. It grew its EPS nicely over the last year, and the healthy balance sheet implies there is more potential for growth. One might conclude that the market is a bit pessimistic, given the low P/E ratio.
When the market is wrong about a stock, it gives savvy investors an opportunity. If the reality for a company is not as bad as the P/E ratio indicates, then the share price should increase as the market realizes this. So this free visual report on analyst forecasts could hold the key to an excellent investment decision.
Of course you might be able to find a better stock than Parex Resources. So you may wish to see this free collection of other companies that have grown earnings strongly.
We aim to bring you long-term focused research analysis driven by fundamental data. Note that our analysis may not factor in the latest price-sensitive company announcements or qualitative material.
If you spot an error that warrants correction, please contact the editor at editorial-team@simplywallst.com. This article by Simply Wall St is general in nature. It does not constitute a recommendation to buy or sell any stock, and does not take account of your objectives, or your financial situation. Simply Wall St has no position in the stocks mentioned. Thank you for reading.
