
 Yahoo Finance
 Do You Know What Johnson Controls International plc's (NYSE:JCI) P/E Ratio Means?

Want to participate in a short research study? Help shape the future of investing tools and you could win a $250 gift card!
The goal of this article is to teach you how to use price to earnings ratios (P/E ratios). We'll look at Johnson Controls International plc's (NYSE:JCI) P/E ratio and reflect on what it tells us about the company's share price. Looking at earnings over the last twelve months, Johnson Controls International has a P/E ratio of 14.93. In other words, at today's prices, investors are paying $14.93 for every $1 in prior year profit.
See our latest analysis for Johnson Controls International
How Do I Calculate Johnson Controls International's Price To Earnings Ratio?
The formula for P/E is:
Price to Earnings Ratio = Price per Share ÷ Earnings per Share (EPS)
Or for Johnson Controls International:
P/E of 14.93 = $39 ÷ $2.61 (Based on the trailing twelve months to March 2019.)
Is A High P/E Ratio Good?
A higher P/E ratio means that buyers have to pay a higher price for each $1 the company has earned over the last year. That is not a good or a bad thing per se, but a high P/E does imply buyers are optimistic about the future.
How Growth Rates Impact P/E Ratios
Probably the most important factor in determining what P/E a company trades on is the earnings growth. When earnings grow, the 'E' increases, over time. Therefore, even if you pay a high multiple of earnings now, that multiple will become lower in the future. And as that P/E ratio drops, the company will look cheap, unless its share price increases.
Johnson Controls International's 58% EPS improvement over the last year was like bamboo growth after rain; rapid and impressive. Even better, EPS is up 19% per year over three years. So we'd absolutely expect it to have a relatively high P/E ratio.
Does Johnson Controls International Have A Relatively High Or Low P/E For Its Industry?
We can get an indication of market expectations by looking at the P/E ratio. If you look at the image below, you can see Johnson Controls International has a lower P/E than the average (17.2) in the building industry classification.
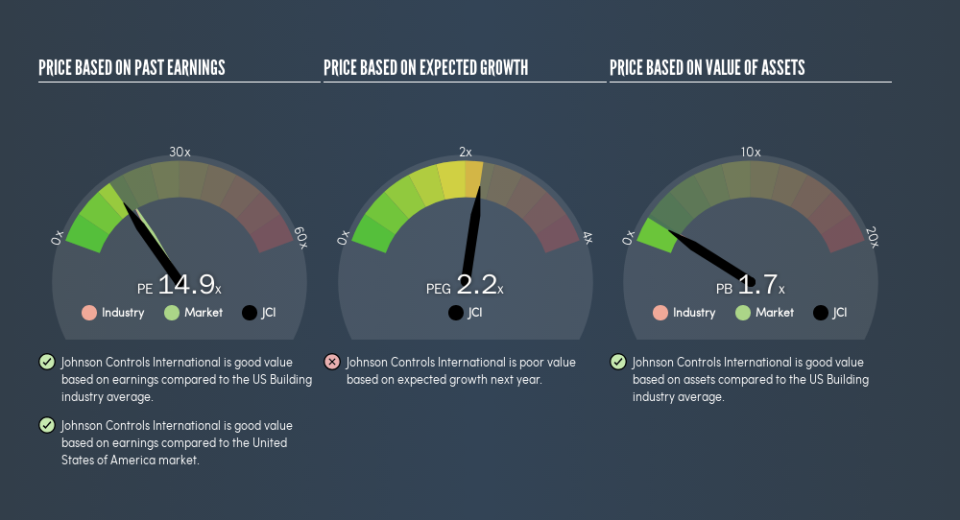
Johnson Controls International's P/E tells us that market participants think it will not fare as well as its peers in the same industry. Many investors like to buy stocks when the market is pessimistic about their prospects. You should delve deeper. I like to check if company insiders have been buying or selling.
A Limitation: P/E Ratios Ignore Debt and Cash In The Bank
The 'Price' in P/E reflects the market capitalization of the company. In other words, it does not consider any debt or cash that the company may have on the balance sheet. The exact same company would hypothetically deserve a higher P/E ratio if it had a strong balance sheet, than if it had a weak one with lots of debt, because a cashed up company can spend on growth.
Such spending might be good or bad, overall, but the key point here is that you need to look at debt to understand the P/E ratio in context.
Johnson Controls International's Balance Sheet
Net debt is 35% of Johnson Controls International's market cap. While it's worth keeping this in mind, it isn't a worry.
The Bottom Line On Johnson Controls International's P/E Ratio
Johnson Controls International's P/E is 14.9 which is below average (17.1) in the US market. The EPS growth last year was strong, and debt levels are quite reasonable. If it continues to grow, then the current low P/E may prove to be unjustified.
When the market is wrong about a stock, it gives savvy investors an opportunity. If it is underestimating a company, investors can make money by buying and holding the shares until the market corrects itself. So this free report on the analyst consensus forecasts could help you make a master move on this stock.
You might be able to find a better buy than Johnson Controls International. If you want a selection of possible winners, check out this free list of interesting companies that trade on a P/E below 20 (but have proven they can grow earnings).
We aim to bring you long-term focused research analysis driven by fundamental data. Note that our analysis may not factor in the latest price-sensitive company announcements or qualitative material.
If you spot an error that warrants correction, please contact the editor at editorial-team@simplywallst.com. This article by Simply Wall St is general in nature. It does not constitute a recommendation to buy or sell any stock, and does not take account of your objectives, or your financial situation. Simply Wall St has no position in the stocks mentioned. Thank you for reading.
