
 Yahoo Finance
 Kinross reports 2022 fourth-quarter and full-year results

Figure 1: Round Mountain – Gold Hill map
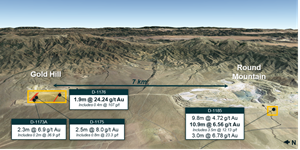
Figure 2: Kettle River – Curlew Basin map
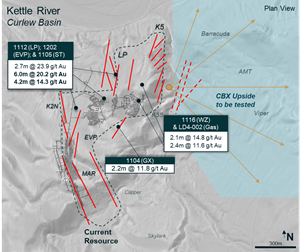
Figure 3: Bald Mountain map

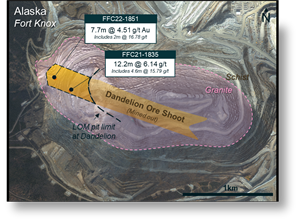
Figure 4: Alaska-Fort Knox map
Portfolio had highest production and lowest costs in Q4
Maintains strong expected production of 2.0 million ounces or above in 2023, 2024 and 2025
Returned $455 million to shareholders in 2022
TORONTO, Feb. 15, 2023 (GLOBE NEWSWIRE) -- Kinross Gold Corporation (TSX: K, NYSE: KGC) (“Kinross” or the “Company”) today announced its results for the fourth-quarter and year ended December 31, 2022.
This news release contains forward-looking information about expected future events and financial and operating performance of the Company. We refer to the risks and assumptions set out in our Cautionary Statement on Forward-Looking Information located on page 39 of this release. All dollar amounts are expressed in U.S. dollars, unless otherwise noted.
Results from the Company's Russian and Ghanaian assets have been excluded from its 2022 continuing results, along with 2021 comparative figures, due to the classification of these assets as discontinued as at December 31, 2022.
2022 Q4 and full-year highlights and outlook:
Production ramped up quarter-after-quarter, with the strongest production and lowest costs of the year in the fourth quarter.
As part of the Great Bear initial resource estimate, the Company has added 2.7 million Au oz. of measured and indicated mineral resources, and added 2.3 million ounces to its inferred mineral resource. See the Great Bear news release here: Great Bear Initial Resource news release. View an interactive 3D model here: Great Bear 3D model.
Tasiast achieved record production in Q4 2022 at lower quarter-over-quarter costs with record grades.
Paracatu achieved its second highest production quarter on record, driven by high grades and strong recoveries.
La Coipa production and throughput increased substantially quarter-over-quarter.
In 2022, Kinross returned $455 million in capital to shareholders consisting of approximately $155 million in dividends and $300 million as part of its enhanced share buyback program. The Company expects to continue its dividend and share buyback programs in 2023 and 2024.
Kinross’ Board of Directors declared a quarterly dividend of $0.03 per common share payable on March 23, 2023 to shareholders of record at the close of business on March 8, 2023.
Kinross expects to increase production to 2.1 million attributable1 Au eq. oz. in 2023 and 2024 and approximately 2 million attributable1 Au eq. oz. in 2025.
2022 Q4 and year-end financial results from continuing operations:
Production of 595,683 Au eq. oz. in Q4 2022, and 1,957,237 Au eq. oz. in 2022.
Production cost of sales2 of $848 per Au eq. oz. in Q4 2022, and $937 per Au eq. oz. in 2022.
All-in sustaining cost3 of $1,236 per Au eq. oz. sold in Q4 2022, and $1,271 per Au eq. oz. sold in 2022.
Margins4 of $883 per Au eq. oz. sold in Q4 2022, and $856 for 2022.
Operating cash flow5 of $474.3 million in Q4 2022, and $1,002.5 million in 2022.
Adjusted operating cash flow3 was $496.1 million in Q4 2022, and $1,256.5 million in 2022.
Free cash flow3 was $157.5 million in Q4 2022, and $238.3 million in 2022.
Reported net loss6 of $106.0 million in Q4 2022, or $0.08 per share, and reported net earnings6 of $31.9 million, or $0.02 per share, in 2022.
Adjusted net earnings3, 7 of $108.2 million, or $0.09 per share in Q4 2022, and $283.1 million, or $0.22 per share, in 2022.
Cash and cash equivalents of $418.1 million, and total liquidity8 of $1.8 billion at December 31, 2022.
Exploration and mineral reserves and resources update:
Excluding the divestitures, Kinross’ total proven and probable mineral reserve estimates decreased by 7.5%, or 2.1 million Au oz., to 25.5 million Au oz., primarily driven by depletion.
Excluding the divestitures, total measured and indicated resource estimates increased by 2%, or 459 Au koz., as the new 2.7 million Au resource estimate at Great Bear more than offset cost pressures. Inferred resource estimates increased by 26% or 2.2 million Au oz. driven by a 2.3 million Au increase at Great Bear.
Manh Choh added 698 Au koz. to its reserve estimates following the completion of the project feasibility study in July 2022.
________________________
1 Attributable production guidance includes Kinross' share of Manh Choh (70%) production.
2 “Production cost of sales from continuing operations per equivalent ounce sold” is defined as production cost of sales, as reported on the consolidated statements of operations, divided by total gold equivalent ounces sold from continuing operations.
3 These figures are non-GAAP financial measures and ratios, as applicable, and are defined and reconciled on pages 20 to 25 of this news release. Non-GAAP financial measures and ratios have no standardized meaning under IFRS and therefore, may not be comparable to similar measures presented by other issuers.
4 “Margins” from continuing operations per equivalent ounce sold is defined as average realized gold price per ounce from continuing operations less production cost of sales from continuing operations per equivalent ounce sold.
5 Operating cash flow figures in this release represent “Net cash flow of continuing operations provided from operating activities,” as reported on the consolidated statements of cash flows.
6 Reported net earnings (loss) figures in this release represent “Net earnings (loss) from continuing operations attributable to common shareholders,” as reported on the consolidated statements of operations.
7 Adjusted net earnings figures in this news release represent “Adjusted net earnings from continuing operations attributable to common shareholders.”
8 “Total liquidity” is defined as the sum of cash and cash equivalents, as reported on the consolidated balance sheets, and available credit under the Company’s credit facilities (as calculated in Section 6 Liquidity and Capital Resources of Kinross’ MD&A for the year ended December 31, 2022).
CEO Commentary:
J. Paul Rollinson, President and CEO, made the following comments in relation to 2022 fourth-quarter and year-end results:
“Reflecting on 2022, it was a challenging year with significant change. I am proud of our global team who came together to address the challenges we faced and am pleased to note that we finished each quarter stronger than the last. As we have exited from Russia and Ghana, and are developing our Great Bear project in Red Lake, Ontario, our portfolio is now more weighted in the Americas. We are excited about the Great Bear initial mineral resource estimate, which we announced earlier this week. We believe we have a world-class development project at Great Bear and two cornerstone production assets, Tasiast and Paracatu, that together produce over 50 per cent of our gold.
“We introduced an enhanced share buyback program which, along with our quarterly dividend, saw us return $455 million to shareholders in 2022, which represented about 8 per cent of our market cap. We expect to continue with our dividend and dynamic buyback program in 2023 and 2024.
“We are proud to be a consistent leader in ESG performance and expect to publish our 2022 Sustainability Report in May. We strengthened Board oversight of ESG and advanced strategy, awareness and programming across the Company, focusing on achieving our targets and metrics to maintain our strong performance. In 2022 we:
Were awarded the Alaska Miners Association Environmental Stewardship Award for our Abandoned Mine Restoration initiative.
Advanced our commitment to diversity, equity and inclusion by working to embed inclusive behaviours into everyday interactions across the Company.
Made more than $10 million of monetary and in-kind contributions through site investments, and provided humanitarian support in Mauritania to help the country manage the impact of extreme weather events.
Advanced our green energy targets with the construction of the Tasiast solar plant, which is expected to come online in the second half of 2023.”
Financial results
Summary of financial and operating results
| Three months ended | Years ended | ||||||||||
| December 31, | December 31, | ||||||||||
(in millions of U.S. dollars, except ounces, per share amounts, and per ounce amounts) |
| 2022 |
|
| 2021 |
|
| 2022 |
|
| 2021 |
|
Operating Highlights |
|
|
|
| ||||||||
Total gold equivalent ounces(a) |
|
|
|
| ||||||||
Produced(b) |
| 595,683 |
|
| 491,077 |
|
| 2,208,453 |
|
| 2,083,016 |
|
Sold(b) |
| 620,599 |
|
| 489,710 |
|
| 2,137,936 |
|
| 2,075,738 |
|
|
|
|
|
| ||||||||
Attributable gold equivalent ounces(a) |
|
|
|
| ||||||||
Produced(b) |
| 595,683 |
|
| 487,621 |
|
| 2,200,247 |
|
| 2,067,549 |
|
Sold(b) |
| 620,599 |
|
| 486,547 |
|
| 2,129,154 |
|
| 2,060,909 |
|
|
|
|
|
| ||||||||
Total gold equivalent ounces from continuing operations(c) |
|
|
|
| ||||||||
Produced(b) |
| 595,683 |
|
| 340,337 |
|
| 1,957,237 |
|
| 1,447,240 |
|
Sold(b) |
| 620,599 |
|
| 342,184 |
|
| 1,927,818 |
|
| 1,446,477 |
|
|
|
|
|
| ||||||||
Financial Highlights from Continuing Operations(c) |
|
|
|
| ||||||||
Metal sales | $ | 1,076.2 |
| $ | 614.9 |
| $ | 3,455.1 |
| $ | 2,599.6 |
|
Production cost of sales | $ | 526.5 |
| $ | 304.3 |
| $ | 1,805.7 |
| $ | 1,218.3 |
|
Depreciation, depletion and amortization | $ | 251.9 |
| $ | 165.4 |
| $ | 784.0 |
| $ | 695.7 |
|
Impairment charges and asset derecognition | $ | 350.0 |
| $ | 144.5 |
| $ | 350.0 |
| $ | 144.5 |
|
Operating (loss) earnings | $ | (160.1 | ) | $ | (137.7 | ) | $ | 117.7 |
| $ | 72.1 |
|
Net (loss) earnings from continuing operations attributable to common shareholders | $ | (106.0 | ) | $ | (66.2 | ) | $ | 31.9 |
| $ | (29.9 | ) |
Basic (loss) earnings per share from continuing operations attributable to common shareholders | $ | (0.08 | ) | $ | (0.05 | ) | $ | 0.02 |
| $ | (0.02 | ) |
Diluted (loss) earnings per share from continuing operations attributable to common shareholders | $ | (0.08 | ) | $ | (0.05 | ) | $ | 0.02 |
| $ | (0.02 | ) |
Adjusted net earnings from continuing operations attributable to common shareholders(d) | $ | 108.2 |
| $ | 27.4 |
| $ | 283.1 |
| $ | 210.8 |
|
Adjusted net earnings from continuing operations per share(d) | $ | 0.09 |
| $ | 0.02 |
| $ | 0.22 |
| $ | 0.17 |
|
Net cash flow of continuing operations provided from operating activities | $ | 474.3 |
| $ | 148.0 |
| $ | 1,002.5 |
| $ | 695.1 |
|
Adjusted operating cash flow from continuing operations(d) | $ | 496.1 |
| $ | 260.4 |
| $ | 1,256.5 |
| $ | 932.1 |
|
Capital expenditures from continuing operations(e) | $ | 316.8 |
| $ | 255.7 |
| $ | 764.2 |
| $ | 821.7 |
|
Free cash flow from continuing operations(d) | $ | 157.5 |
| $ | (107.7 | ) | $ | 238.3 |
| $ | (126.6 | ) |
Average realized gold price per ounce from continuing operations(f) | $ | 1,731 |
| $ | 1,797 |
| $ | 1,793 |
| $ | 1,797 |
|
Production cost of sales from continuing operations per equivalent ounce(b) sold(g) | $ | 848 |
| $ | 889 |
| $ | 937 |
| $ | 842 |
|
Production cost of sales from continuing operations per ounce sold on a by-product basis(d) | $ | 793 |
| $ | 882 |
| $ | 912 |
| $ | 833 |
|
All-in sustaining cost from continuing operations per ounce sold on a by-product basis(d) | $ | 1,203 |
| $ | 1,482 |
| $ | 1,255 |
| $ | 1,238 |
|
All-in sustaining cost from continuing operations per equivalent ounce(b) sold(d) | $ | 1,236 |
| $ | 1,485 |
| $ | 1,271 |
| $ | 1,244 |
|
Attributable all-in cost(h) from continuing operations per ounce sold on a by-product basis(d) | $ | 1,525 |
| $ | 1,884 |
| $ | 1,538 |
| $ | 1,631 |
|
Attributable all-in cost(h) from continuing operations per equivalent ounce(b) sold(d) | $ | 1,540 |
| $ | 1,883 |
| $ | 1,545 |
| $ | 1,632 |
|
(a) Total gold equivalent ounces produced and sold and attributable gold equivalent ounces produced and sold include results from the Kupol, Dvoinoye and Chirano mines up to their disposal. "Total gold equivalent ounces" includes 100% of Chirano production. "Attributable gold equivalent ounces" includes Kinross' share of Chirano (90%) production.
(b) “Gold equivalent ounces” include silver ounces produced and sold converted to a gold equivalent based on a ratio of the average spot market prices for the commodities for each period. The ratio for 2022 was 82.90:1 (2021 – 71.51:1).
(c) On June 15, 2022, the Company announced that it had completed the sale of its Russian operations, which includes the Kupol and Dvoinoye mines and the Udinsk project. On August 10, 2022, the Company announced that it had completed the sale of its Chirano mine in Ghana. Results for the years ended December 31, 2022 and 2021 are from continuing operations and exclude results from the Company’s Chirano and Russian operations due to the classification of these operations as discontinued as at December 31, 2022.
(d) The definition and reconciliation of these non-GAAP financial measures and ratios is included on pages 20 to 25 of this news release. Non-GAAP financial measures and ratios have no standardized meaning under IFRS and therefore, may not be comparable to similar measures presented by other issuers.
(e) “Capital expenditures from continuing operations” is reported as “Additions to property, plant and equipment” on the consolidated statements of cash flows.
(f) “Average realized gold price per ounce from continuing operations” is defined as gold metal sales from continuing operations divided by total gold ounces sold from continuing operations.
(g) “Production cost of sales from continuing operations per equivalent ounce sold” is defined as production cost of sales divided by total gold equivalent ounces sold from continuing operations.
(h) “Attributable all-in cost” includes Kinross’ share of Manh Choh (70%) costs.
The following operating and financial results are based on fourth-quarter and year-end 2022 gold equivalent production:
Production: Kinross produced 595,683 Au eq. oz. from continuing operations in Q4 2022, compared with 340,337 Au eq. oz. from continuing operations in Q4 2021.
Over the full year, Kinross produced 1,957,237 Au eq. oz. from continuing operations, largely in line with the Company’s revised production guidance, compared with full-year 2021 production of 1,447,240 Au eq. oz. from continuing operations. The 35% year-over-year increase was largely a result of higher production at Tasiast due to the temporary suspension of milling operations in the prior year, and production at La Coipa due to the restart and ramp-up in the current year.
Average realized gold price: The average realized gold price from continuing operations in Q4 2022 was $1,731 per ounce, compared with $1,797 per ounce in Q4 2021. For full-year 2022, the average realized gold price per ounce from continuing operations was $1,793, in line with $1,797 per ounce for full-year 2021.
Revenue: During the fourth quarter, revenue from continuing operations was $1,076.2 million, compared with $614.9 million during Q4 2021. Revenue from continuing operations was $3,455.1 million for full-year 2022, compared with $2,599.6 million for full-year 2021. The 33% year-over-year increase is due to the increase in production at Tasiast and La Coipa.
Production cost of sales: Production cost of sales from continuing operations per Au eq. oz. sold decreased to $848 for Q4 2022, compared with $889 in Q4 2021. Production cost of sales2 from continuing operations per Au eq. oz. sold was $937 for full-year 2022, compared with $842 per Au eq. oz. for full-year 2021. The increase was mainly due to inflationary cost pressure on key consumables such as fuel, emulsion and reagents across the portfolio.
Production cost of sales from continuing operations per Au oz. sold on a by-product basis3 was $793 in Q4 2022 compared with $882 in Q4 2021, based on gold sales of 586,146 ounces and silver sales of 2,820,983 ounces. Production cost of sales from continuing operations per Au eq. oz. sold on a by-product basis3 was $912 for full-year 2022, compared with $833 for full-year 2021, based on 2022 gold sales of 1,872,342 ounces and silver sales of 4,647,415 ounces.
Margins4: Kinross’ margin from continuing operations per Au eq. oz. sold was $883 for Q4 2022, compared with the Q4 2021 margin of $908. Full-year 2022 margin from continuing operations per Au eq. oz. sold was $856, compared with $955 for full-year 2021.
All-in sustaining cost3: All-in sustaining cost from continuing operations per Au eq. oz. sold was $1,236 in Q4 2022, compared with $1,485 in Q4 2021. Full-year all-in sustaining cost from continuing operations per Au eq. oz. sold was $1,271, compared with $1,244 for full-year 2021.
In Q4 2022, all-in sustaining cost from continuing operations per Au oz. sold on a by-product basis was $1,203, compared with $1,482 in Q4 2021. All-in sustaining cost from continuing operations per Au oz. sold on a by-product basis was $1,255 for full-year 2022, compared with $1,238 in 2021.
Operating cash flow: Operating cash flow from continuing operations was $474.3 million for Q4 2022, compared with $148.0 million for Q4 2021. Operating cash flow from continuing operations for full-year 2022 was $1,002.5 million, compared with $695.1 million for full-year 2021, primarily due to the increase in gold equivalent ounces sold arising from higher production.
Adjusted operating cash flow3 from continuing operations for Q4 2022 was $496.1 million, compared with $260.4 million for Q4 2021. Adjusted operating cash flow3 from continuing operations for full-year 2022 was $1,256.5 million, compared with $932.1 million in 2021.
Free cash flow3: Free cash flow from continuing operations was $157.5 million in Q4 2022, compared with a net cash outflow of $107.7 million for Q4 2021. For the full year, free cash flow from continuing operations was $238.3 million, compared with a net cash outflow of $126.6 million the previous year. The increase in both periods was mainly due to an increase in Au eq. oz. sold, insurance recoveries related to the 2021 Tasiast mill fire, and a reduction in other operating expenses.
Impairment charge: Kinross recorded a non-cash, after-tax impairment charge of $289.3 million at Round Mountain. The impairment charge is related to changes to the mine plan and slope design, and increased costs due to inflation.
Earnings: Reported net loss from continuing operations was $106.0 million for Q4 2022, or $0.08 per share, compared with reported net loss of $66.2 million, or $0.05 per share, for Q4 2021. Reported net earnings in full-year 2022 was $31.9 million, or $0.02 per share, compared with reported net loss of $29.9 million, or $0.02 per share, in 2021.
Adjusted net earnings3, 7 from continuing operations were $108.2 million, or $0.09 per share, for Q4 2022, compared with $27.4 million, or $0.02 per share, for Q4 2021. Full-year adjusted net earnings3, 7 from continuing operations were $283.1 million, or $0.22 per share, compared with $210.8 million, or $0.17 per share, for full-year 2021, primarily due to the increase in Au eq. oz. sold.
Capital expenditures: Capital expenditures from continuing operations increased to $316.8 million for Q4 2022, compared with $255.7 million for Q4 2021. Capital expenditures from continuing operations for full-year 2022 were $764.2 million, compared with $821.7 million in 2021. The decrease was primarily due to a decrease in capital stripping at certain sites, partially offset by increased development activities at La Coipa.
Balance sheet
As of December 31, 2022, Kinross had cash and cash equivalents of $418.1 million, compared with $531.5 million at December 31, 2021.
The Company had additional available credit9 of $1,362.9 million as of December 31, 2022, and total liquidity8 of approximately $1.8 billion.
________________________
9 “Available credit” is defined as available credit under the Company’s credit facilities and is calculated in Section 6 Liquidity and Capital Resources of Kinross’ MD&A for the year ended December 31, 2022.
Return of capital
In 2022, Kinross bolstered its capital allocation strategy through its enhanced share buyback and quarterly dividend programs. During the past year, Kinross returned $455 million in capital to shareholders, consisting of approximately $155 million in dividends and $300 million as part of its share buyback program, an increase of approximately $200 million compared with the prior year. In 2023 and 2024, the Company expects to maintain its dynamic share buyback program, which is based on an allocation of excess free cash flow, and baseline dividend programs while reinvesting in the business and maintaining its investment grade balance sheet.
As part of its continuing quarterly dividend program, the Company declared a dividend of $0.03 per common share payable on March 23, 2023, to shareholders of record as of March 8, 2023.
Operating results
Mine-by-mine summaries for 2022 fourth-quarter operating results may be found on pages 15 and 19 of this news release. Highlights include the following:
Tasiast achieved record production and record grades during the quarter. Cost of sales per ounce sold was lower quarter-over-quarter mainly due to the increase in production and higher year-over-year mainly due to higher operating waste mined. Full-year production was higher due to the temporary suspension of milling operations in the prior year. During the quarter, the Company successfully finalized a three-year collective labour agreement at Tasiast with no interruption to operations.
Paracatu continued to perform well and achieved its second highest production quarter on record, driven by high grades and strong recoveries. Production for the full-year 2022 increased compared with the previous year largely due to higher grades and recoveries. Full-year cost of sales per ounce sold increased largely due to inflationary pressures, partially offset by increased ounces sold. Cost of sales per ounce sold decreased quarter-over-quarter due to higher production.
Fort Knox full-year production increased year-over-year largely due to increased mill throughput and ounces recovered from the heap leach pads, as production from the Barnes Creek heap leach pad ramped up. Full-year cost of sales per ounce sold increased primarily due to inflationary cost pressures on consumables and higher contractor costs related to mining the Gil deposit. Q4 2022 was the strongest production quarter of the year at Fort Knox largely due to more ounces recovered from the Barnes Creek heap leach pad, partially offset by marginally lower mill grades and recovery. Lower quarter-over-quarter unit costs are mainly due to the increase in production.
At Bald Mountain, full-year production increased compared to 2021 due to an increase in ounces recovered from the heap leach pads. For the full year, cost of sales per ounce increased year-over-year largely due to inflationary cost pressures on consumables, partially offset by the increase in ounces sold. Production in Q4 2022 decreased quarter-over-quarter mainly due to fewer ounces recovered from the heap leach. Quarter-over-quarter unit costs were lower primarily due to an increase in ounces sold.
At Round Mountain, full-year production was lower year-over-year, primarily due to the timing of ounces recovered from the heap leach pads. Cost of sales per ounce sold was higher for the full year mainly due to lower production, fewer lower-cost ounces recovered from the heap leach pads, and inflationary cost pressures on consumables, cyanide in particular. Production and cost of sales per ounce sold were in line quarter-over-quarter.
The Company completed the Round Mountain Optimization program in the third quarter and decided to prioritize underground opportunities at Phase X and Gold Hill as they show potential for higher-margin, higher-return operations as compared to the open pit expansions at Phase W3 and Phase S. The Company plans to start construction of an underground exploration decline at Phase X in the first half of 2023. The Company is continuing to mine Phase W (W1 and W2) while progressing underground opportunities. The open pit expansion opportunities at Phase W3 and Phase S remain in reserves and will continue to be optimized and evaluated for potential exploitation with sustained macroeconomic improvements.
La Coipa poured its first gold in February 2022 and fourth quarter production showed significant quarter-over-quarter improvement as Q4 throughput ramped up and as mining and processing grades increased. Fourth quarter gold production has ramped up and exceeded quarterly forecast levels for 2023. La Coipa has a planned mill shutdown in February for maintenance work aimed at increasing reliability to sustain throughput. Cost of sales per ounce sold was higher quarter-over-quarter largely due to higher processing costs related to maintenance and contractors.
Development projects
Tasiast
The Tasiast 24k project continues to progress on schedule to reach throughput of 24,000 t/d by mid-year and ramp-up to operate consistently at design tonnage by the end of the year. The final expansion to the leach circuit is now complete and has successfully been put into operation. The plant is currently undergoing a planned shutdown to allow for the installation of tie ins as part of the work for the 24k project. Civil works are substantially complete and the mechanical contractor is advancing with the installation of an additional classifying cyclone which is the final stage in the series of 24k debottlenecking scopes.
The 34MW Tasiast solar power plant continues to advance and remains on schedule for completion in the second half of 2023. Engineering is focused on deliverables for integration with existing power infrastructure. Delivery of materials at site has started and all photovoltaic modules are in transit or have arrived. Construction is underway and earthworks are ongoing. Mechanical works commenced in early February and electrical works are expected to commence in early March.
Great Bear
Kinross announced a robust initial mineral resource at the Great Bear project on February 13, 2023. The initial mineral resource estimate consists of 2.737 Moz. of indicated resources and 2.290 Moz. of inferred resources.
Read the announcement here: Great Bear Initial Resource news release.
View an interactive 3D model here: Great Bear 3D Model.
Manh Choh
At the 70% owned Manh Choh project, activities remain on schedule and on budget, with the early works program progressing as planned. Camp refurbishments were completed in advance of the construction season and all long-lead procurement orders for both the Fort Knox mill modifications and the Manh Choh site have been placed. The Company has selected an Alaska-based supplier for the life-of-mine ore haul trucking and has also awarded the contract mining to a company with significant experience working in Alaska. This contract will include initial construction along with mining and closure activities. Permitting is progressing well and a public comment period is expected to open in early 2023 regarding the Company’s applications. Kinross continues to focus on safely advancing the project, listening to stakeholder concerns, and building on relationships with the local communities and the Native Village of Tetlin.
The Company announced on July 27, 2022, that it was proceeding with the Manh Choh project as the operator of the joint venture. Initial production from Manh Choh is expected in the second half of 2024 and is expected to add approximately 640,000 attributable Au eq. oz. to the Company’s production profile over its approximately 4.5 years life of mine.
Lobo-Marte
Kinross’ activities in Chile are currently focused on La Coipa and opportunities to extend its mine life up to the end of the decade with the potential of additional pushbacks. The Lobo-Marte project continues to provide optionality as a potential large, low-cost mine upon the conclusion of mining at La Coipa. While the Company focuses its technical resources on La Coipa, it will continue to engage and build relationships with communities related to Lobo-Marte and government stakeholders.
Company Guidance
The following section of the news release represents forward-looking information and users are cautioned that actual results may vary. We refer to the risks and assumptions contained in the Cautionary Statement on Forward-Looking Information on page 39 of this news release.
This Company Guidance section below and breakdown summarized in Appendix A of this news release references all-in sustaining cost per equivalent ounce sold and sustaining and non-sustaining capital expenditures, which are non-GAAP ratios and financial measures, as applicable, with no standardized meaning under IFRS and therefore, may not be comparable to similar measures presented by other issuers. The definitions of these non-GAAP ratios and financial measures and and comparable reconciliations are included on pages 20 to 25 of this news release.
The Company’s guidance, including commodity price, foreign currency exchange rate assumptions, and a breakdown of guidance by country, is summarized in Appendix A: Refer to page 32 of this news release.
Production guidance
In 2023, Kinross expects to produce 2.1 million Au eq. oz. (+/- 5%) from its operations, which is an increase of approximately 140,000 Au eq. oz. compared with 2022 production. Kinross’ annual production is expected to remain stable in 2024 and 2025 at 2.1 million and 2.0 million attributable1 Au eq. oz. (+/- 5%), respectively.
Production is forecasted to be lower in the first quarter of 2023 compared with the rest of the year, mainly as a result of the current shutdown at Tasiast related to the 24k project, the on-going ramp-up including planned mill shutdown at La Coipa, and the seasonal impacts on mining at Paracatu and on the Company’s US heap leach operations.
Cost guidance
Production cost of sales is expected to be $970 per Au eq. oz. (+/- 5%) for 2023. In 2022, production cost of sales was $937 per Au eq. oz. The moderate year-over-year increase is mainly due to inflationary impacts, including higher costs for labour and consumables.
The Company expects its all-in sustaining cost3 to be $1,320 per Au eq. oz. (+/- 5%) for 2023. In 2022, all-in sustaining cost3 was $1,271 per Au eq. oz. sold.
Capital expenditures guidance
Attributable capital expenditures10 for 2023 are forecast to be approximately $1.0 billion (+/- 5%) and are summarized in the table in Appendix A. The capital expenditures guidance is higher than the prior year mainly due to carryover of capital stripping from 2022 into 2023 across the portfolio, and the advancement of the Manh Choh project and project studies at Great Bear.
Kinross’ attributable capital expenditures10 outlook for 2024 and 2025 is $850 million and $700 million, respectively, based on currently approved projects. As Kinross continues to develop and optimize its portfolio for production beyond 2025, other projects may be incorporated into its capital expenditures, as well as potential inflationary impacts, over the 2023-2024 timeframe.
Other 2023 guidance
The 2023 forecast for exploration11 is $150 million (+/- 5%), of which approximately $5 million is expected to be capitalized, and is a $10 million increase from last year’s revised guidance. The exploration program (greenfields and brownfields) will follow up on 2022’s exploration success, and will focus on Great Bear, developing the Phase X exploration drift at Round Mountain, and underground exploration at Curlew Basin.
The 2023 forecast for overhead (general and administrative and business development expenses) is $135 million (+/- 5%), which is in line with the 2022 results, and approximately $25 million less than the Company’s previous year guidance primarily as a result of adjustments to Kinross’ regional head office presence to align with its Americas-focused portfolio following the divestitures in 2022.
Other operating costs expected to be incurred in 2023 are approximately $100 million, which are principally related to care and maintenance and reclamation.
Tax expense is expected to be $135 million and taxes paid is expected to be $105 million. Adjusting the Brazilian real and Mauritanian Ouguiya to the respective exchange rates of 5.22 and 36.64 to the U.S. dollar in effect at December 31, 2022, the tax expense would be expected to be approximately $175 million. Tax expense is expected to increase by 25% of any profit resulting from higher gold prices. Taxes paid is expected to increase by approximately $8 million for every $100 movement in the realized gold price.
Depreciation, depletion and amortization is forecast to be approximately $450 per Au eq. oz. sold (+/- 5%).
Interest paid is forecast to be approximately $160 million, which includes approximately $90 million of capitalized interest.
________________________
10 Attributable capital expenditure guidance includes Kinross’ share of Manh Choh (70%) capital expenditures.
11 Included in 2023 exploration guidance of $150 million are approximately $5 million of capitalized infill drilling costs related to the Great Bear project. These costs are also included in Great Bear’s approximately $40 million capital guidance. See also Appendix A.
Environment, Social and Governance
In 2022, Kinross continued its strong ESG performance. ESG is a key factor in the Company’s culture, business strategy and future growth plans. The Company completed the development of its ESG strategy and strengthened its ESG governance structure including monthly ESG Executive Committee meetings and enhancing Board of Directors’ oversight with updates to the Board and Committee charter documents and quarterly reports from the ESG Executive Committee.
Kinross maintained consistently high ratings as measured by S&P CSA, MSCI, Refinitiv, Moody’s ESG, and Sustainalytics. In The Globe and Mail’s annual Board Games governance rating, Kinross was ranked the highest among Canadian mining companies. The Company also began the process of external assurance towards its conformance with the Responsible Gold Mining Principles, which were established by the World Gold Council.
Across sites, operational ESG performance focused on the Company’s First Priorities including health and safety, environment, and communities. In health and safety, the Company maintained low injury frequency rates that were in line with three-year averages. However, this was overshadowed by a tragic employee fatality at the Tasiast mine in July 2022. The Company continues to prioritize health and safety as its first priority and a newly established Global Safety Learning Forum reinforces the Company’s people-centric and progressive philosophy with a focus on sharing learnings across sites.
In environment, Kinross Alaska recently received the Alaska Miners Association Environmental Stewardship Award for best management practices in environmental protection or restoration initiatives for its partnership with Trout Unlimited to create the Alaska Abandoned Mine Restoration initiative (click here for video). In host communities, a high level of interactions was maintained and more than $10 million of monetary and in-kind contributions were made through site community investment strategies throughout the year. In the fourth quarter, humanitarian support was provided in several parts of Mauritania due to extreme weather conditions which affected people’s homes and livelihoods.
Kinross continues to make strides in its commitment to diversity, equity and inclusion (DEI) by working with key community partners, such as the Canadian Centre for Diversity Inclusion (CCDI), Catalyst, the Black North Initiative, Women in Mining, the Mining Industry Human Resources Council, and many others, to offer our employees opportunities to learn and embed inclusive behaviours in their everyday interactions. In addition, the Kinross Global Inclusion and Diversity Council, comprised of Kinross’ senior leaders, has successfully provided two years of strategic direction and oversight for the many DEI initiatives within the organization.
For more information on Kinross’ sustainability performance, see the Company’s 2021 Sustainability Report and its ESG Analyst Centre located on the Company website. The Sustainability Report follows the Global Reporting Initiative (GRI) and Sustainability Accounting Standards Board (SASB) reporting standards and fulfills Kinross’ commitment as a participant in the UN Global Compact. The Company’s 2022 Sustainability Report is expected to be published in May 2023.
Kinross continues to advance its ESG strategy across its assets by conducting workshops with sites to advance their ESG strategy. It continues to monitor legislative initiatives and evolving ESG reporting frameworks, and will update reporting as required.
Exploration update
Exploration efforts and engineering optimization added a total of approximately 380 Au koz. in estimated mineral reserves before depletion in 2022; 530 Au koz. in measured and indicated; and 2.23 million Au oz. inferred. The majority of the additions are from Great Bear.
Brownfields exploration
The Company’s exploration efforts continued to focus within the footprint of existing mines during 2022, with a total of 336,019 metres of drilling completed for all exploration projects.
Highlights of the 2022 brownfields exploration program include significant results at the Company’s North America assets: Round Mountain, Curlew Basin, Bald Mountain and Alaska. The 2022 programs focused on expanding key targets, and 2023 will test high-grade zones.
• Round Mountain: Phase X Underground drilling confirmed continuity of mineralization in a key zone for both thickness and grade. Several significant intercepts were received within the broader zone of mineralization including:
D-1185 – 9.8m @ 4.72 g/t Au; 10.9m @ 6.56 g/t Au, (includes 3.5m @ 12.13 g/t Au); and 3.0m @ 6.78 g/t Au (includes 0.9 @ 22.40 g/t Au).
The 2023 Round Mountain exploration program will focus on supporting Phase X Underground development, geological modeling, and drilling.
• Drilling at Gold Hill extended two major vein zones a cumulative total of 1150 metres along strike and intercepted several new veins outside the existing model. The Gold Hill vein system remains open along strike, with prospective structure, veining, and alteration observed in the furthest west holes outlined below (See Appendix B: Figure 1 for Round Mountain – Gold Hill map).
The 2021 Alexandria vein discovery was extended over 750 metres along strike this year, significant intercept highlights include:
D-1166 – 2.1m @ 8.92 g/t Au, includes 0.3m @ 31.20 g/t Au
D-1176 – 1.9m @ 24.24 g/t Au, includes 0.4m @ 107.00 g/t Au
The Jersey (formerly Main) vein zone was extended over 400 metres west along strike, with robust structure, veining, and alteration observed in the furthest west hole at Gold Hill to-date (results pending). Significant intercept highlights include:
D-1173A – 2.3m @ 6.93 g/t Au, includes 0.2m @ 36.90 g/t Au
D-1173A – 2.3 m @ 6.01 g/t Au, includes 0.8m @ 13.96 g/t Au
D-1175 – 2.5m @ 8.04 g/t Au, includes 0.8m @ 23.30 g/t Au
• Curlew Basin: Exploration drilling resulted in a 157 koz. increase in indicated and 157 koz. in inferred resource this year, bringing the current indicated resource total to 393 koz. at 6.5 g/t Au. Drilling will continue from the new underground exploration drifts which were completed in 2022. Underground exploration drilling (19,000 metres) confirmed numerous vein zone extensions and continuity across multiple targets, which will continue to add to the resource in 2023. Highlights from drilling are listed below: (See Appendix B: Figure 2 for Curlew Basin map).
Stealth 1105 – 6.0m @ 20.15 g/t Au (highest grade thickness intercept in >5 years from Curlew)
LP 1112 – 2.7m @ 23.89 g/t Au
Gas LD4-002 – 2.1m @ 14.84 g/t Au
EVP 1202 – 4.2m @ 14.26 g/t Au
WZ 1116 – 2.4m @ 11.59 g/t Au
K5 – all assays pending
• Bald Mountain: Exploration tested primarily the North area of operations with 8,150 metres of drilling completed over six target areas. A priority focus was on adding volume to Top underground where drilling documented high-grade mineralization in a critical space and confirmed oxide mineralization continues at significant distances beyond previously known intercepts. (See Appendix B: Figure 3 for Bald Mountain map). Highlights from 2022 results include:
TD21-006 – 24.2m @ 19.24 g/t Au
TD22-008 – 4.6m @ 6.80 g/t Au
Zed Williams is located southeast of the previously mined Numbers pits and is located within the Bida-trend intrusive related zone of mineralization. The target is primarily near-surface and consists of thick intervals of low-grade mineralization over a broad area. 2022 Drilling highlights include:
NA22-016 – 26.5m @ 1.76 g/t Au and 8.8m @ 4.07 g/t Au
NA22-015 – 40.9m @ 0.69 g/t Au, includes 6.4m @ 3.09 g/t Au
ZWD22-016 – 56.4m @ 0.64 g/t Au, includes 13.1m @ 1.79 g/t Au
• Alaska: Drilling at the Fort Knox mine proved high-grade mineralization extends 300 metres outside the current life-of-mine pit along the Dandelion Ore Shear. Additionally, exploration sampled geotechnical and other holes which also yielded significant results: (See Appendix B: Figure 4 for Alaska-Fort Knox map).
FFC21-1835 – 12.2m @ 6.14 g/t Au, includes 4.6m @ 15.79 g/t Au (2021 geotech assays received in 2022)
FFC22-1851 – 7.7m @ 4.51 g/t Au, includes 2.0m @ 16.78 g/t Au
At Manh Choh, 1,979 metres of drilling was completed at the North-East, Discovery, and Ridgeline targets, the results of which are pending. Extensive regional reconnaissance was conducted at the greater Tetlin lease area, which generated several zones of interest for follow-up.
In 2023, Exploration will focus on testing the extent and continuity of higher-grade ore-shears, outside of the current resource shell at Fort Knox. Fairbanks District Exploration will continue to test early-stage targets. Brownfields exploration will continue in and around Manh Choh, as well as on the encouraging reconnaissance results in the broader land package.
Great Bear
In 2022, Kinross completed a total of 250,000 metres of drilling, including 225,000 metres of diamond exploration drilling. Kinross recently announced a robust estimate comprised of an initial mineral resource of 2.7 million oz. indicated and 2.3 million oz. inferred at Great Bear.
Drilling results continue to support the view of a high-grade, world-class deposit that underpins the prospect of a large, long-life mining complex. Results have also confirmed gold mineralization with good widths and high grades below the resource, including high-grade mineralization at depths of more than 1,000 metres.
Kinross’ focus for 2023 will be exploration of additional targets on Great Bear’s land package, as well as exploration of the LP zone along strike and at depth with the goal of further delineating the deposit at depth as well as adding inferred resource ounces.
The Company is also progressing studies and permitting for an advanced exploration program that would establish an underground decline to obtain a bulk sample and allow for more efficient exploration of deeper areas of the LP Fault, along with the nearby Hinge and Limb gold zones. Kinross is targeting a potential start of the advanced program as early as 2024.
For more information about the Great Bear initial resource estimate, read the February 13, 2023, news release here: Great Bear Initial Resource news release.
Greenfields exploration update
Kinross’ greenfields exploration strategy is to identify areas that have the potential to host high-grade gold deposits. The Company looks for opportunities where it can stake its own claims or collaborate with high-quality junior exploration companies through joint venture or equity investment. Kinross’ primary focus is for orogenic, epithermal, Carlin and intrusion related deposits.
The greenfields exploration programs in 2022 focused on targets in Canada, Nevada, and Finland with approximately 49,200m of drilling completed on all projects.
Canada
In Canada, exploration focused on the large land holdings in Snow Lake, Manitoba, where both reconnaissance and detailed mapping and prospecting took place followed by diamond drilling of priority targets.
In Dryden, Ontario, work on the Company’s joint venture (JV) property consisted of mechanical stripping, detail mapping and channel sampling followed by diamond drilling.
In Red Lake, Ontario, prospecting and mapping on two properties that were acquired as part of the Great Bear Resources acquisition in early 2022 was completed.
Nevada
Work on the 100% owned Nevada properties consisted of airborne geophysics, soil sampling, mapping, prospecting and reverse circulation (RC) drilling of priority targets. High-grade epithermal and Carlin style mineralization remain the primary targets in Nevada.
In Nevada, mapping on our Goldbanks property lead to the discovery of mineralized quartz veining at surface. RC drilling of the area returned the following highlights:
GB22-04 – 3.0m @ 2.05 g/t Au; and 4.6m @ 2.31 g/t Au
GB22-07 – 29.0m @ 0.48 g/t Au; and 6.1m @ 1.01 g/t Au
GB22-11 – 25.9m @ 1.60 g/t Au, including 1.5m @ 15.40 g/t Au
GB22-12 – 1.5m @ 9.96 g/t Au; and 7.6m @ 0.50 g/t Au
Additional mapping and drilling are planned for the Goldbanks property in 2023.
Finland
Exploration efforts in Finland predominantly consisted of base of till (BoT) drilling on the Company’s JV properties in the Central Lapland Greenstone Belt. A diamond drilling program followed up on the highest priority BoT results and intersected low-grade gold mineralization. Base of till drilling will continue on the properties in 2023 and drill targets readied at the end of last year will be tested this winter.
In both Canada and Finland, Kinross’ focus is on projects that could host high grade, mesothermal style gold mineralization.
2023 Focus
For 2023, the exploration guidance (brownfields and greenfields) is $150 million (+/- 5%) compared with $135.9 million spent in 2022. The 2023 program will follow up on 2022’s exploration success, including the exploration of additional targets at Great Bear in addition to the LP zone along strike and at depth, at Round Mountain related to the Phase X and Gold Hill opportunities, and potentially building on the resource at Curlew Basin.
Great Bear: Kinross is budgeting approximately $45 million11 for exploration of the large land package, including exploration of the LP zone along strike and at depth.
Round Mountain: Kinross is budgeting approximately $40 million for the construction of a drift for underground exploration drilling at Phase X, and to conduct surface exploration at Gold Hill and the greater Round Mountain district.
Alaska: Kinross is budgeting approximately $10 million in Alaska for Fort Knox and Manh Choh, testing near-mine, regional and generative targets around both deposits.
A more detailed summary of 2022 highlights is presented below. Additional details may be found in the Appendices.
“Appendix B” provides illustrations, captions, and accompanying explanatory notes, and “Appendix C” provides complete drilling results and drill hole location data corresponding to the values below.
Appendix B: Refer to page 35 of this news release.
Appendix C: www.kinross.com/Exploration-Drill-Results-Appendix-C-Q4-YE-2022
2022 Mineral Reserves and Mineral Resources update
(See also the Company’s detailed Annual Mineral Reserve and Mineral Resource Statement estimated as at December 31, 2022 and explanatory notes starting at page 27.)
Kinross increased its gold price assumptions for mineral reserves from $1,200 per ounce to $1,400 per ounce and mineral resource from $1,600 per ounce to $1,700 per ounce, as of December 31, 202212. Gold price assumptions have been increased to better reflect the rising spot price of gold.
The Company also increased its silver price assumption from $17 per ounce to $17.50 per ounce for its mineral reserve estimates, but has decreased its silver price assumption to $21.30 per ounce, from $22 per ounce for estimated mineral resources.
Kinross continues to prioritize quality, high-margin, low-cost ounces in its portfolio, and maintained its fully loaded costing methodology.
Kinross Gold Mineral Reserve and Mineral Resource estimates after divestitures13 | ||||
| 2021 | Depletion | Exploration & | 2022 |
Proven and Probable Reserves | 27,609 | (2,448) | 374 | 25,535 |
Measured and Indicated Resources | 25,752 | (71) | 530 | 26,211 |
Inferred Resources | 8,341 | (53) | 2,234 | 10,522 |
Proven and Probable Mineral Reserves
Excluding the Company’s former Russian and Ghanaian assets, Kinross’ proven and probable mineral reserve estimates decreased by 7.5% or 2.1 million Au oz., primarily driven by depletion.
The Company’s total proven and probable silver mineral reserve estimate decreased by 16% to 36.1 million Ag oz. at year-end 2022, compared with 42.9 million Ag oz. at year-end 2021. The decrease was due to depletion at La Coipa, offset by reserve additions at Manh Choh.
Measured and Indicated Mineral Resources
Kinross’ total measured and indicated (M&I) mineral resource estimate at year-end 2022 was 26.2 million Au oz. compared with 25.8 million Au oz. at year-end 2021, excluding the divestitures. This increase was driven by the initial resource at Great Bear which added 2.7 million Au oz., offset by resource decreases caused by increased costs across all assets, namely Tasiast and Fort Knox.
The Company’s total measured and indicated silver resources decreased by 5% to 37.6 million Ag oz. at year-end 2022, compared with 39.5 million Ag oz. at year-end 2021. The decrease was mostly due the conversion of resource to reserve at Manh Choh.
Inferred Mineral Resources
Kinross’ total inferred mineral resource estimate increased to 10.5 million Au oz. at year-end 2022, compared with 8.3 million Au oz. at year-end 2021, excluding the divestitures. The increase can be attributed to Great Bear which declared 2.3 million ounces of inferred mineral resources, and Tasiast which added to its inferred underground resource estimate. Increases were partially offset by decreases at Fort Knox and Tasiast open pits.
________________________
12 Please see page 27 for Mineral Reserve and Mineral Resource Statement Notes.
13 Rounding of values to the 000s may result in apparent discrepancies.
Conference call details
In connection with this news release, Kinross will hold a conference call and audio webcast on Thursday, February 16, 2023, at 8 a.m. ET to discuss the results, followed by a question-and-answer session. To access the call, please dial:
Canada & US toll-free – +1 (888) 330-2446; Passcode: 4915537
Outside of Canada & US – +1 (240) 789-2732; Passcode: 4915537
Replay (available up to 14 days after the call):
Canada & US toll-free – +1 (800) 770-2030; Passcode: 4915537
Outside of Canada & US – +1 (647) 362-9199; Passcode: 4915537
You may also access the conference call on a listen-only basis via webcast at our website www.kinross.com. The audio webcast will be archived on www.kinross.com.
This release should be read in conjunction with Kinross’ 2022 year-end Financial Statements and Management’s Discussion and Analysis report at www.kinross.com. Kinross’ 2022 year-end Financial Statements and Management’s Discussion and Analysis have been filed with Canadian securities regulators (available at www.sedar.com) and furnished with the U.S. Securities and Exchange Commission (available at www.sec.gov). Kinross shareholders may obtain a copy of the financial statements free of charge upon request to the Company.
About Kinross Gold Corporation
Kinross is a Canadian-based global senior gold mining company with operations and projects in the United States, Brazil, Mauritania, Chile and Canada. Our focus is on delivering value based on the core principles of responsible mining, operational excellence, disciplined growth, and balance sheet strength. Kinross maintains listings on the Toronto Stock Exchange (symbol:K) and the New York Stock Exchange (symbol:KGC).
Media Contact
Victoria Barrington
Senior Director, Corporate Communications
phone: 647-788-4153
victoria.barrington@kinross.com
Investor Relations Contact
Chris Lichtenheldt
Vice-President, Investor Relations
phone: 416-365-2761
chris.lichtenheldt@kinross.com
Review of operations
Three months ended |
|
|
|
|
|
|
|
|
|
|
| ||||
| Gold equivalent ounces |
|
|
|
|
|
|
| |||||||
| Produced |
| Sold |
| Production cost of |
| Production cost of | ||||||||
| 2022 | 2021 |
| 2022 | 2021 |
|
| 2022 |
| 2021 |
|
| 2022 |
| 2021 |
|
|
|
|
|
|
|
|
|
|
|
| ||||
Fort Knox | 83,739 | 73,830 |
| 87,061 | 74,384 |
| $ | 102.1 | $ | 74.1 |
| $ | 1,173 | $ | 996 |
Round Mountain | 61,929 | 51,549 |
| 67,484 | 52,723 |
|
| 95.1 |
| 51.8 |
|
| 1,409 |
| 982 |
Bald Mountain | 58,521 | 61,036 |
| 66,847 | 53,559 |
|
| 62.8 |
| 50.1 |
|
| 939 |
| 935 |
Paracatu | 180,809 | 138,669 |
| 183,190 | 145,691 |
|
| 130.3 |
| 116.9 |
|
| 711 |
| 802 |
La Coipa | 67,683 | - |
| 68,135 | - |
|
| 39.4 |
| - |
|
| 578 |
| - |
Maricunga | - | - |
| 863 | 821 |
|
| 0.6 |
| 0.6 |
|
| 695 |
| 731 |
Americas Total | 452,681 | 325,084 |
| 473,580 | 327,178 |
|
| 430.3 |
| 293.5 |
|
| 909 |
| 897 |
|
|
|
|
|
|
|
|
|
|
|
| ||||
Tasiast | 143,002 | 15,253 |
| 147,019 | 15,006 |
|
| 96.2 |
| 10.8 |
|
| 654 |
| 720 |
West Africa Total | 143,002 | 15,253 |
| 147,019 | 15,006 |
|
| 96.2 |
| 10.8 |
|
| 654 |
| 720 |
|
|
|
|
|
|
|
|
|
|
|
| ||||
Continuing Operations Total | 595,683 | 340,337 |
| 620,599 | 342,184 |
|
| 526.5 |
| 304.3 |
|
| 848 |
| 889 |
|
|
|
|
|
|
|
|
|
|
|
| ||||
Discontinued Operations |
|
|
|
|
|
|
|
|
|
|
| ||||
Kupol | - | 116,179 |
| - | 115,893 |
|
| - |
| 75.2 |
| $ | - | $ | 649 |
Chirano (100%) | - | 34,561 |
| - | 31,633 |
|
| - |
| 45.7 |
|
| - |
| 1,445 |
| - | 150,740 |
| - | 147,526 |
|
| - |
| 120.9 |
|
|
| ||
|
|
|
|
|
|
|
|
|
|
|
| ||||
|
|
|
|
|
|
|
|
|
|
|
| ||||
| |||||||||||||||
Years months ended |
|
|
|
|
|
|
|
|
|
|
| ||||
| Gold equivalent ounces |
|
|
|
|
|
|
| |||||||
| Produced |
| Sold |
| Production cost of |
| Production cost of | ||||||||
| 2022 | 2021 |
| 2022 | 2021 |
|
| 2022 |
| 2021 |
|
| 2022 |
| 2021 |
|
|
|
|
|
|
|
|
|
|
|
| ||||
Fort Knox | 291,248 | 264,283 |
| 291,793 | 263,590 |
| $ | 350.7 | $ | 267.2 |
| $ | 1,202 | $ | 1,014 |
Round Mountain | 226,374 | 257,005 |
| 227,655 | 259,941 |
|
| 309.2 |
| 235.9 |
|
| 1,358 |
| 908 |
Bald Mountain | 214,094 | 204,890 |
| 214,808 | 196,066 |
|
| 208.8 |
| 177.5 |
|
| 972 |
| 905 |
Paracatu | 577,354 | 550,560 |
| 571,164 | 549,900 |
|
| 497.6 |
| 412.1 |
|
| 871 |
| 749 |
La Coipa | 109,576 | - |
| 99,915 | - |
|
| 57.2 |
| - |
|
| 572 |
| - |
Maricunga | - | - |
| 3,191 | 2,787 |
|
| 2.1 |
| 2.0 |
|
| 658 |
| 718 |
Americas Total | 1,418,646 | 1,276,738 |
| 1,408,526 | 1,272,284 |
|
| 1,425.6 |
| 1,094.7 |
|
| 1,012 |
| 860 |
|
|
|
|
|
|
|
|
|
|
|
| ||||
Tasiast | 538,591 | 170,502 |
| 519,292 | 174,193 |
|
| 380.1 |
| 123.6 |
|
| 732 |
| 710 |
West Africa Total | 538,591 | 170,502 |
| 519,292 | 174,193 |
|
| 380.1 |
| 123.6 |
|
| 732 |
| 710 |
|
|
|
|
|
|
|
|
|
|
|
| ||||
Continuing Operations Total | 1,957,237 | 1,447,240 |
| 1,927,818 | 1,446,477 |
|
| 1,805.7 |
| 1,218.3 |
|
| 937 |
| 842 |
|
|
|
|
|
|
|
|
|
|
| |||||
Discontinued Operations |
|
|
|
|
|
|
|
|
|
|
| ||||
Kupol | 169,156 | 481,108 |
| 122,295 | 480,968 |
|
| 83.8 |
| 306.2 |
|
| 685 |
| 637 |
Chirano (100%) | 82,060 | 154,668 |
| 87,823 | 148,293 |
|
| 131.2 |
| 201.6 |
|
| 1,494 |
| 1,359 |
| 251,216 | 635,776 |
| 210,118 | 629,261 |
|
| 215.0 |
| 507.8 |
|
|
| ||
Consolidated balance sheets
(expressed in millions of U.S. dollars, except share amounts) |
|
|
|
|
| ||||
|
|
|
|
|
| ||||
|
| As at |
| ||||||
|
| December 31, |
| December 31, |
| ||||
|
|
| 2022 |
|
|
| 2021 |
|
|
|
|
|
|
|
| ||||
Assets |
|
|
|
|
| ||||
Current assets |
|
|
|
|
| ||||
Cash and cash equivalents |
| $ | 418.1 |
|
| $ | 531.5 |
|
|
Restricted cash |
|
| 10.1 |
|
|
| 11.4 |
|
|
Accounts receivable and other assets |
|
| 318.2 |
|
|
| 214.5 |
|
|
Current income tax recoverable |
|
| 8.5 |
|
|
| 10.2 |
|
|
Inventories |
|
| 1,072.2 |
|
|
| 1,151.3 |
|
|
Unrealized fair value of derivative assets |
|
| 25.5 |
|
|
| 30.0 |
|
|
|
|
| 1,852.6 |
|
|
| 1,948.9 |
|
|
Non-current assets |
|
|
|
|
| ||||
Property, plant and equipment |
|
| 7,741.4 |
|
|
| 7,617.7 |
|
|
Goodwill |
|
| - |
|
|
| 158.8 |
|
|
Long-term investments |
|
| 116.9 |
|
|
| 98.2 |
|
|
Other long-term assets |
|
| 680.9 |
|
|
| 598.0 |
|
|
Deferred tax assets |
|
| 4.6 |
|
|
| 6.5 |
|
|
Total assets |
| $ | 10,396.4 |
|
| $ | 10,428.1 |
|
|
|
|
|
|
|
| ||||
Liabilities |
|
|
|
|
| ||||
Current liabilities |
|
|
|
|
| ||||
Accounts payable and accrued liabilities |
| $ | 550.0 |
|
| $ | 492.7 |
|
|
Current income tax payable |
|
| 89.4 |
|
|
| 95.0 |
|
|
Current portion of long-term debt and credit facilities |
|
| 36.0 |
|
|
| 40.0 |
|
|
Current portion of provisions |
|
| 50.8 |
|
|
| 90.0 |
|
|
Other current liabilities |
|
| 25.3 |
|
|
| 23.7 |
|
|
|
|
| 751.5 |
|
|
| 741.4 |
|
|
Non-current liabilities |
|
|
|
|
| ||||
Long-term debt and credit facilities |
|
| 2,556.9 |
|
|
| 1,589.9 |
|
|
Provisions |
|
| 755.9 |
|
|
| 847.9 |
|
|
Long-term lease liabilities |
|
| 23.1 |
|
|
| 35.1 |
|
|
Other long-term liabilities |
|
| 125.3 |
|
|
| 127.4 |
|
|
Deferred tax liabilities |
|
| 301.5 |
|
|
| 436.8 |
|
|
Total liabilities |
| $ | 4,514.2 |
|
| $ | 3,778.5 |
|
|
|
|
|
|
|
| ||||
Equity |
|
|
|
|
| ||||
Common shareholders' equity |
|
|
|
|
| ||||
Common share capital |
| $ | 4,449.5 |
|
| $ | 4,427.7 |
|
|
Contributed surplus |
|
| 10,667.5 |
|
|
| 10,664.4 |
|
|
Accumulated deficit |
|
| (9,251.6 | ) |
|
| (8,492.4 | ) |
|
Accumulated other comprehensive income (loss) |
|
| (41.7 | ) |
|
| (18.8 | ) |
|
Total common shareholders' equity |
|
| 5,823.7 |
|
|
| 6,580.9 |
|
|
Non-controlling interests |
|
| 58.5 |
|
|
| 68.7 |
|
|
Total equity |
|
| 5,882.2 | ||||||
