
 Yahoo Finance
 Kinder Morgan (NYSE:KMI) Has Some Way To Go To Become A Multi-Bagger
There are a few key trends to look for if we want to identify the next multi-bagger. Firstly, we'll want to see a proven return on capital employed (ROCE) that is increasing, and secondly, an expanding base of capital employed. Basically this means that a company has profitable initiatives that it can continue to reinvest in, which is a trait of a compounding machine. Having said that, from a first glance at Kinder Morgan (NYSE:KMI) we aren't jumping out of our chairs at how returns are trending, but let's have a deeper look.
Return On Capital Employed (ROCE): What is it?
For those who don't know, ROCE is a measure of a company's yearly pre-tax profit (its return), relative to the capital employed in the business. Analysts use this formula to calculate it for Kinder Morgan:
Return on Capital Employed = Earnings Before Interest and Tax (EBIT) ÷ (Total Assets - Current Liabilities)
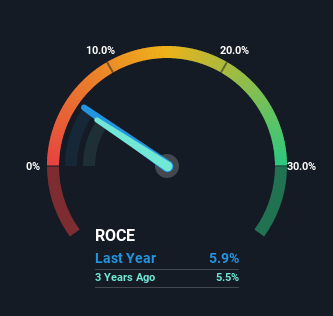
0.059 = US$3.7b ÷ (US$69b - US$6.5b) (Based on the trailing twelve months to March 2022).
So, Kinder Morgan has an ROCE of 5.9%. In absolute terms, that's a low return and it also under-performs the Oil and Gas industry average of 11%.
See our latest analysis for Kinder Morgan
In the above chart we have measured Kinder Morgan's prior ROCE against its prior performance, but the future is arguably more important. If you'd like to see what analysts are forecasting going forward, you should check out our free report for Kinder Morgan.
How Are Returns Trending?
Things have been pretty stable at Kinder Morgan, with its capital employed and returns on that capital staying somewhat the same for the last five years. This tells us the company isn't reinvesting in itself, so it's plausible that it's past the growth phase. So unless we see a substantial change at Kinder Morgan in terms of ROCE and additional investments being made, we wouldn't hold our breath on it being a multi-bagger. That being the case, it makes sense that Kinder Morgan has been paying out 96% of its earnings to its shareholders. Most shareholders probably know this and own the stock for its dividend.
Our Take On Kinder Morgan's ROCE
In a nutshell, Kinder Morgan has been trudging along with the same returns from the same amount of capital over the last five years. And investors may be recognizing these trends since the stock has only returned a total of 26% to shareholders over the last five years. Therefore, if you're looking for a multi-bagger, we'd propose looking at other options.
If you want to know some of the risks facing Kinder Morgan we've found 5 warning signs (2 are a bit unpleasant!) that you should be aware of before investing here.
If you want to search for solid companies with great earnings, check out this free list of companies with good balance sheets and impressive returns on equity.
Have feedback on this article? Concerned about the content? Get in touch with us directly. Alternatively, email editorial-team (at) simplywallst.com.
This article by Simply Wall St is general in nature. We provide commentary based on historical data and analyst forecasts only using an unbiased methodology and our articles are not intended to be financial advice. It does not constitute a recommendation to buy or sell any stock, and does not take account of your objectives, or your financial situation. We aim to bring you long-term focused analysis driven by fundamental data. Note that our analysis may not factor in the latest price-sensitive company announcements or qualitative material. Simply Wall St has no position in any stocks mentioned.
