
 Yahoo Finance
 What Kind Of Shareholders Own RNC Minerals (TSE:RNX)?

The big shareholder groups in RNC Minerals (TSE:RNX) have power over the company. Institutions will often hold stock in bigger companies, and we expect to see insiders owning a noticeable percentage of the smaller ones. I quite like to see at least a little bit of insider ownership. As Charlie Munger said ‘Show me the incentive and I will show you the outcome.’
RNC Minerals is a smaller company with a market capitalization of CA$236m, so it may still be flying under the radar of many institutional investors. Taking a look at the our data on the ownership groups (below), it’s seems that institutions are not really that prevalent on the share registry. We can zoom in on the different ownership groups, to learn more about RNX.
See our latest analysis for RNC Minerals

What Does The Institutional Ownership Tell Us About RNC Minerals?
Institutional investors commonly compare their own returns to the returns of a commonly followed index. So they generally do consider buying larger companies that are included in the relevant benchmark index.
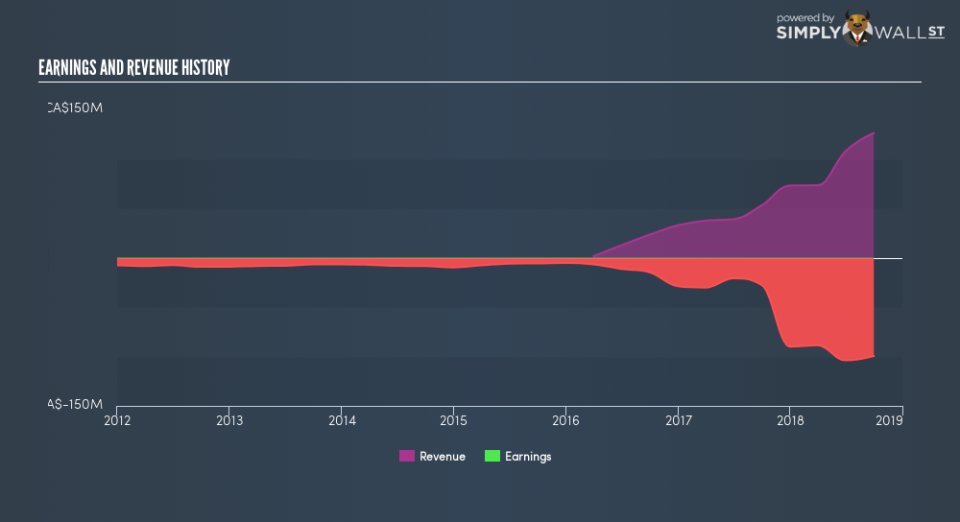
Since institutions own under 5% of RNC Minerals, many may not have spent much time considering the stock. But it’s clear that some have; and they liked it enough to buy in. So if the company itself can improve over time, we may well see more institutional buyers in the future. When multiple institutional investors want to buy shares, we often see a rising share price. The past revenue trajectory (shown below) can be an indication of future growth, but there are no guarantees.
We note that hedge funds don’t have a meaningful investment in RNC Minerals. There is a little analyst coverage of the stock, but not much. So there is room for it to gain more coverage.
Insider Ownership Of RNC Minerals
The definition of an insider can differ slightly between different countries, but members of the board of directors always count. The company management answer to the board; and the latter should represent the interests of shareholders. Notably, sometimes top-level managers are on the board, themselves.
I generally consider insider ownership to be a good thing. However, on some occasions it makes it more difficult for other shareholders to hold the board accountable for decisions.
Our most recent data indicates that insiders own a reasonable proportion of RNC Minerals. Insiders own CA$28m worth of shares in the CA$236m company. It is great to see insiders so invested in the business. It might be worth checking if those insiders have been buying recently.
General Public Ownership
The general public — mostly retail investors — own 86% of RNC Minerals . This size of ownership gives retail investors collective power. They can and probably do influence decisions on executive compensation, dividend policies and proposed business acquisitions.
Next Steps:
I find it very interesting to look at who exactly owns a company. But to truly gain insight, we need to consider other information, too.
I like to dive deeper into how a company has performed in the past. You can find historic revenue and earnings in this detailed graph.
If you would prefer discover what analysts are predicting in terms of future growth, do not miss this free report on analyst forecasts.
NB: Figures in this article are calculated using data from the last twelve months, which refer to the 12-month period ending on the last date of the month the financial statement is dated. This may not be consistent with full year annual report figures.
To help readers see past the short term volatility of the financial market, we aim to bring you a long-term focused research analysis purely driven by fundamental data. Note that our analysis does not factor in the latest price-sensitive company announcements.
The author is an independent contributor and at the time of publication had no position in the stocks mentioned. For errors that warrant correction please contact the editor at editorial-team@simplywallst.com.
