
 Yahoo Finance
 What Kind Of Share Price Volatility Should You Expect For Bee Vectoring Technologies International Inc. (CVE:BEE)?

Anyone researching Bee Vectoring Technologies International Inc. (CVE:BEE) might want to consider the historical volatility of the share price. Volatility is considered to be a measure of risk in modern finance theory. Investors may think of volatility as falling into two main categories. The first category is company specific volatility. This can be dealt with by limiting your exposure to any particular stock. The second type is the broader market volatility, which you cannot diversify away, since it arises from macroeconomic factors which directly affects all the stocks on the market.
Some stocks are more sensitive to general market forces than others. Beta is a widely used metric to measure a stock's exposure to market risk (volatility). Before we go on, it's worth noting that Warren Buffett pointed out in his 2014 letter to shareholders that 'volatility is far from synonymous with risk.' Having said that, beta can still be rather useful. The first thing to understand about beta is that the beta of the overall market is one. Any stock with a beta of greater than one is considered more volatile than the market, while those with a beta below one are either less volatile or poorly correlated with the market.
Check out our latest analysis for Bee Vectoring Technologies International
What we can learn from BEE's beta value
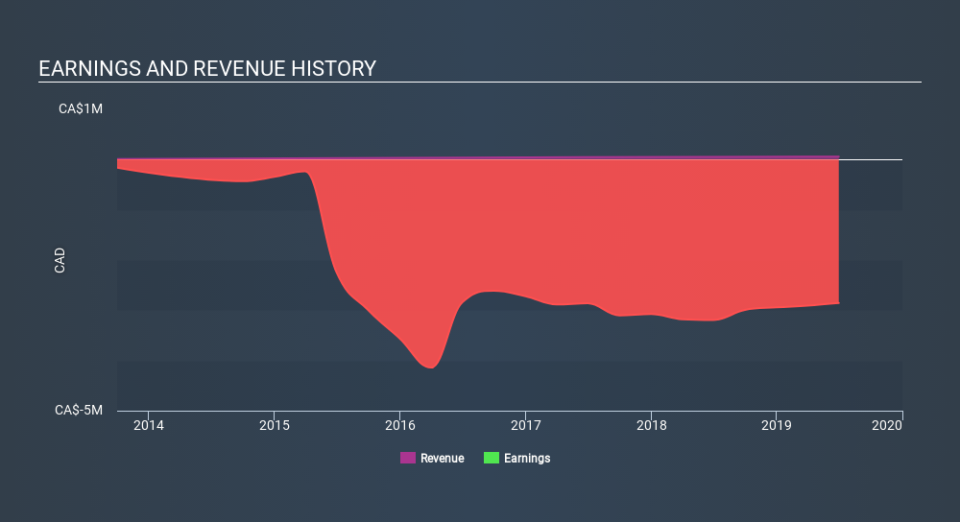
Zooming in on Bee Vectoring Technologies International, we see it has a five year beta of 1.23. This is above 1, so historically its share price has been influenced by the broader volatility of the stock market. If this beta value holds true in the future, Bee Vectoring Technologies International shares are likely to rise more than the market when the market is going up, but fall faster when the market is going down. Beta is worth considering, but it's also important to consider whether Bee Vectoring Technologies International is growing earnings and revenue. You can take a look for yourself, below.
Does BEE's size influence the expected beta?
With a market capitalisation of CA$38m, Bee Vectoring Technologies International is a very small company by global standards. It is quite likely to be unknown to most investors. Relatively few investors can influence the price of a smaller company, compared to a large company. This could explain the high beta value, in this case.
What this means for you:
Since Bee Vectoring Technologies International has a reasonably high beta, it's worth considering why it is so heavily influenced by broader market sentiment. For example, it might be a high growth stock or have a lot of operating leverage in its business model. In order to fully understand whether BEE is a good investment for you, we also need to consider important company-specific fundamentals such as Bee Vectoring Technologies International’s financial health and performance track record. I urge you to continue your research by taking a look at the following:
Past Track Record: Has BEE been consistently performing well irrespective of the ups and downs in the market? Go into more detail in the past performance analysis and take a look at the free visual representations of BEE's historicals for more clarity.
Other High-Performing Stocks: Are there other stocks that provide better prospects with proven track records? Explore our free list of these great stocks here.
If you spot an error that warrants correction, please contact the editor at editorial-team@simplywallst.com. This article by Simply Wall St is general in nature. It does not constitute a recommendation to buy or sell any stock, and does not take account of your objectives, or your financial situation. Simply Wall St has no position in the stocks mentioned.
We aim to bring you long-term focused research analysis driven by fundamental data. Note that our analysis may not factor in the latest price-sensitive company announcements or qualitative material. Thank you for reading.
