
 Yahoo Finance
 What Kind Of Investor Owns Most Of CME Group Inc. (NASDAQ:CME)?

Want to participate in a short research study? Help shape the future of investing tools and you could win a $250 gift card!
Every investor in CME Group Inc. (NASDAQ:CME) should be aware of the most powerful shareholder groups. Insiders often own a large chunk of younger, smaller, companies while huge companies tend to have institutions as shareholders. Companies that have been privatized tend to have low insider ownership.
CME Group is a pretty big company. It has a market capitalization of US$64b. Normally institutions would own a significant portion of a company this size. Taking a look at our data on the ownership groups (below), it's seems that institutions are noticeable on the share registry. Let's delve deeper into each type of owner, to discover more about CME.
See our latest analysis for CME Group
What Does The Institutional Ownership Tell Us About CME Group?
Many institutions measure their performance against an index that approximates the local market. So they usually pay more attention to companies that are included in major indices.
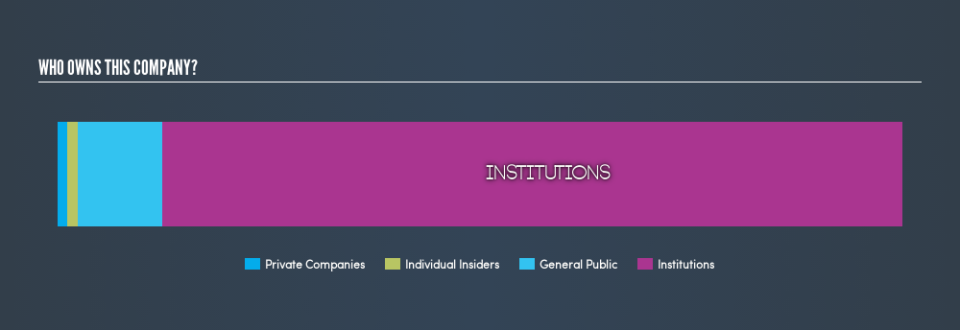
As you can see, institutional investors own 87% of CME Group. This suggests some credibility amongst professional investors. But we can't rely on that fact alone, since institutions make bad investments sometimes, just like everyone does. It is not uncommon to see a big share price drop if two large institutional investors try to sell out of a stock at the same time. So it is worth checking the past earnings trajectory of CME Group, (below). Of course, keep in mind that there are other factors to consider, too.

Institutional investors own over 50% of the company, so together than can probably strongly influence board decisions. CME Group is not owned by hedge funds. Quite a few analysts cover the stock, so you could look into forecast growth quite easily.
Insider Ownership Of CME Group
While the precise definition of an insider can be subjective, almost everyone considers board members to be insiders. Management ultimately answers to the board. However, it is not uncommon for managers to be executive board members, especially if they are a founder or the CEO.
I generally consider insider ownership to be a good thing. However, on some occasions it makes it more difficult for other shareholders to hold the board accountable for decisions.
Our most recent data indicates that insiders own some shares in CME Group Inc.. Insiders own US$819m worth of shares (at current prices). It is good to see this level of investment. You can check here to see if those insiders have been buying recently.
General Public Ownership
With a 10% ownership, the general public have some degree of sway over CME. This size of ownership, while considerable, may not be enough to change company policy if the decision is not in sync with other large shareholders.
Next Steps:
I find it very interesting to look at who exactly owns a company. But to truly gain insight, we need to consider other information, too.
I always like to check for a history of revenue growth. You can too, by accessing this free chart of historic revenue and earnings in this detailed graph.
If you would prefer discover what analysts are predicting in terms of future growth, do not miss this free report on analyst forecasts.
NB: Figures in this article are calculated using data from the last twelve months, which refer to the 12-month period ending on the last date of the month the financial statement is dated. This may not be consistent with full year annual report figures.
We aim to bring you long-term focused research analysis driven by fundamental data. Note that our analysis may not factor in the latest price-sensitive company announcements or qualitative material.
If you spot an error that warrants correction, please contact the editor at editorial-team@simplywallst.com. This article by Simply Wall St is general in nature. It does not constitute a recommendation to buy or sell any stock, and does not take account of your objectives, or your financial situation. Simply Wall St has no position in the stocks mentioned. Thank you for reading.