
 Yahoo Finance
 Key Things To Watch Out For If You Are After Tullow Oil plc's (LON:TLW) 7.3% Dividend

Dividend paying stocks like Tullow Oil plc (LON:TLW) tend to be popular with investors, and for good reason - some research suggests a significant amount of all stock market returns come from reinvested dividends. If you are hoping to live on your dividends, it's important to be more stringent with your investments than the average punter. Regular readers know we like to apply the same approach to each dividend stock, and we hope you'll find our analysis useful.
In this case, Tullow Oil likely looks attractive to investors, given its 7.3% dividend yield and a payment history of over ten years. We'd guess that plenty of investors have purchased it for the income. Remember that the recent share price drop will make Tullow Oil's yield look higher, even though recent events might have impacted the company's prospects. When buying stocks for their dividends, you should always run through the checks below, to see if the dividend looks sustainable.
Click the interactive chart for our full dividend analysis
Payout ratios
Dividends are usually paid out of company earnings. If a company is paying more than it earns, then the dividend might become unsustainable - hardly an ideal situation. So we need to form a view on if a company's dividend is sustainable, relative to its net profit after tax. Looking at the data, we can see that 50% of Tullow Oil's profits were paid out as dividends in the last 12 months. A medium payout ratio strikes a good balance between paying dividends, and keeping enough back to invest in the business. Plus, there is room to increase the payout ratio over time.
We also measure dividends paid against a company's levered free cash flow, to see if enough cash was generated to cover the dividend. Tullow Oil's cash payout ratio last year was 13%. Cash flows are typically lumpy, but this looks like an appropriately conservative payout. It's positive to see that Tullow Oil's dividend is covered by both profits and cash flow, since this is generally a sign that the dividend is sustainable, and a lower payout ratio usually suggests a greater margin of safety before the dividend gets cut.
Is Tullow Oil's Balance Sheet Risky?
As Tullow Oil has a meaningful amount of debt, we need to check its balance sheet to see if the company might have debt risks. A quick check of its financial situation can be done with two ratios: net debt divided by EBITDA (earnings before interest, tax, depreciation and amortisation), and net interest cover. Net debt to EBITDA measures total debt load relative to company earnings (lower = less debt), while net interest cover measures the ability to pay interest on the debt (higher = greater ability to pay interest costs). Tullow Oil has net debt of 2.03 times its EBITDA. Using debt can accelerate business growth, but also increases the risks.
We calculated its interest cover by measuring its earnings before interest and tax (EBIT), and dividing this by the company's net interest expense. With EBIT of 1.89 times its interest expense, Tullow Oil's interest cover is starting to look a bit thin.
We update our data on Tullow Oil every 24 hours, so you can always get our latest analysis of its financial health, here.
Dividend Volatility
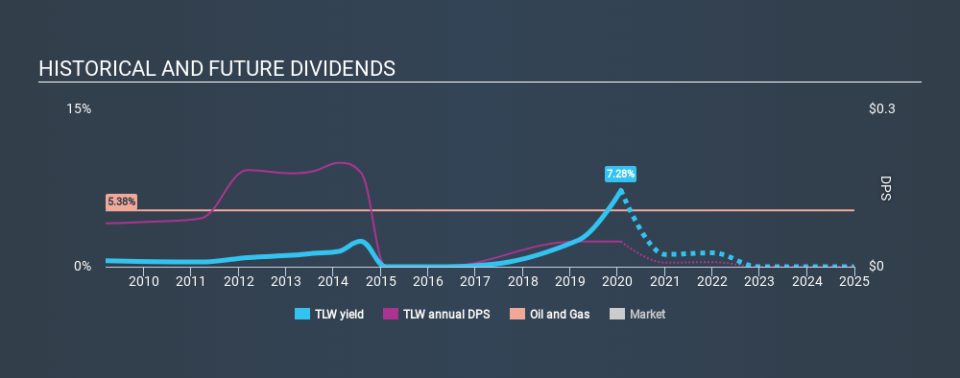
One of the major risks of relying on dividend income, is the potential for a company to struggle financially and cut its dividend. Not only is your income cut, but the value of your investment declines as well - nasty. Tullow Oil has been paying dividends for a long time, but for the purpose of this analysis, we only examine the past 10 years of payments. Its dividend payments have declined on at least one occasion over the past ten years. During the past ten-year period, the first annual payment was US$0.083 in 2010, compared to US$0.048 last year. The dividend has shrunk at around 5.3% a year during that period. Tullow Oil's dividend has been cut sharply at least once, so it hasn't fallen by 5.3% every year, but this is a decent approximation of the long term change.
When a company's per-share dividend falls we question if this reflects poorly on either external business conditions, or the company's capital allocation decisions. Either way, we find it hard to get excited about a company with a declining dividend.
Dividend Growth Potential
Given that dividend payments have been shrinking like a glacier in a warming world, we need to check if there are some bright spots on the horizon. Tullow Oil's earnings per share have shrunk at 12% a year over the past five years. With this kind of significant decline, we always wonder what has changed in the business. Dividends are about stability, and Tullow Oil's earnings per share, which support the dividend, have been anything but stable.
Conclusion
Dividend investors should always want to know if a) a company's dividends are affordable, b) if there is a track record of consistent payments, and c) if the dividend is capable of growing. It's great to see that Tullow Oil is paying out a low percentage of its earnings and cash flow. Second, earnings per share have been in decline, and its dividend has been cut at least once in the past. Ultimately, Tullow Oil comes up short on our dividend analysis. It's not that we think it is a bad company - just that there are likely more appealing dividend prospects out there on this analysis.
Without at least some growth in earnings per share over time, the dividend will eventually come under pressure either from costs or inflation. Very few businesses see earnings consistently shrink year after year in perpetuity though, and so it might be worth seeing what the 18 analysts we track are forecasting for the future.
We have also put together a list of global stocks with a market capitalisation above $1bn and yielding more 3%.
If you spot an error that warrants correction, please contact the editor at editorial-team@simplywallst.com. This article by Simply Wall St is general in nature. It does not constitute a recommendation to buy or sell any stock, and does not take account of your objectives, or your financial situation. Simply Wall St has no position in the stocks mentioned.
We aim to bring you long-term focused research analysis driven by fundamental data. Note that our analysis may not factor in the latest price-sensitive company announcements or qualitative material. Thank you for reading.
