
 Yahoo Finance
 Key Things To Watch Out For If You Are After Ardagh Group S.A.'s (NYSE:ARD) 2.8% Dividend

Dividend paying stocks like Ardagh Group S.A. (NYSE:ARD) tend to be popular with investors, and for good reason - some research suggests a significant amount of all stock market returns come from reinvested dividends. If you are hoping to live on the income from dividends, it's important to be a lot more stringent with your investments than the average punter.
With only a three-year payment history, and a 2.8% yield, investors probably think Ardagh Group is not much of a dividend stock. Many of the best dividend stocks typically start out paying a low yield, so we wouldn't automatically cut it from our list of prospects. There are a few simple ways to reduce the risks of buying Ardagh Group for its dividend, and we'll go through these below.
Explore this interactive chart for our latest analysis on Ardagh Group!
Payout ratios
Dividends are typically paid from company earnings. If a company pays more in dividends than it earned, then the dividend might become unsustainable - hardly an ideal situation. So we need to form a view on if a company's dividend is sustainable, relative to its net profit after tax. Although it reported a loss over the past 12 months, Ardagh Group currently pays a dividend. When a company is loss-making, we next need to check to see if its cash flows can support the dividend.
Of the free cash flow it generated last year, Ardagh Group paid out 36% as dividends, suggesting the dividend is affordable.
Is Ardagh Group's Balance Sheet Risky?
Given Ardagh Group is paying a dividend but reported a loss over the past year, we need to check its balance sheet for signs of financial distress. A rough way to check this is with these two simple ratios: a) net debt divided by EBITDA (earnings before interest, tax, depreciation and amortisation), and b) net interest cover. Net debt to EBITDA is a measure of a company's total debt. Net interest cover measures the ability to meet interest payments. Essentially we check that a) the company does not have too much debt, and b) that it can afford to pay the interest. Ardagh Group has net debt of 5.04 times its EBITDA, which implies meaningful risk if interest rates rise of earnings decline.
We calculated its interest cover by measuring its earnings before interest and tax (EBIT), and dividing this by the company's net interest expense. Interest cover of 1.79 times its interest expense is starting to become a concern for Ardagh Group, and be aware that lenders may place additional restrictions on the company as well. High debt and weak interest cover are not a great combo, and we would be cautious of relying on this company's dividend while these metrics persist.
We update our data on Ardagh Group every 24 hours, so you can always get our latest analysis of its financial health, here.
Dividend Volatility
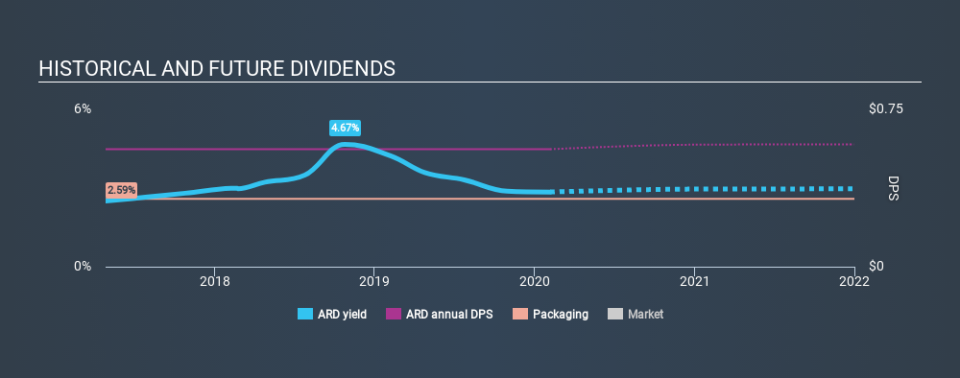
One of the major risks of relying on dividend income, is the potential for a company to struggle financially and cut its dividend. Not only is your income cut, but the value of your investment declines as well - nasty. The company has been paying a stable dividend for a few years now, but we'd like to see more evidence of consistency over a longer period. Its most recent annual dividend was US$0.56 per share, effectively flat on its first payment three years ago.
It's good to see at least some dividend growth. Yet with a relatively short dividend paying history, we wouldn't want to depend on this dividend too heavily.
Dividend Growth Potential
While dividend payments have been relatively reliable, it would also be nice if earnings per share (EPS) were growing, as this is essential to maintaining the dividend's purchasing power over the long term. It's good to see Ardagh Group has been growing its earnings per share at 149% a year over the past five years.
Conclusion
To summarise, shareholders should always check that Ardagh Group's dividends are affordable, that its dividend payments are relatively stable, and that it has decent prospects for growing its earnings and dividend. We're not keen on the fact that Ardagh Group paid dividends despite reporting a loss over the past year, although fortunately its dividend was covered by cash flow. Next, earnings growth has been good, but unfortunately the company has not been paying dividends as long as we'd like. In sum, we find it hard to get excited about Ardagh Group from a dividend perspective. It's not that we think it's a bad business; just that there are other companies that perform better on these criteria.
Earnings growth generally bodes well for the future value of company dividend payments. See if the 7 Ardagh Group analysts we track are forecasting continued growth with our free report on analyst estimates for the company.
Looking for more high-yielding dividend ideas? Try our curated list of dividend stocks with a yield above 3%.
If you spot an error that warrants correction, please contact the editor at editorial-team@simplywallst.com. This article by Simply Wall St is general in nature. It does not constitute a recommendation to buy or sell any stock, and does not take account of your objectives, or your financial situation. Simply Wall St has no position in the stocks mentioned.
We aim to bring you long-term focused research analysis driven by fundamental data. Note that our analysis may not factor in the latest price-sensitive company announcements or qualitative material. Thank you for reading.
