
 Yahoo Finance
 What Is Kering's (EPA:KER) P/E Ratio After Its Share Price Tanked?

Unfortunately for some shareholders, the Kering (EPA:KER) share price has dived 32% in the last thirty days. Even longer term holders have taken a real hit with the stock declining 22% in the last year.
Assuming nothing else has changed, a lower share price makes a stock more attractive to potential buyers. In the long term, share prices tend to follow earnings per share, but in the short term prices bounce around in response to short term factors (which are not always obvious). The implication here is that long term investors have an opportunity when expectations of a company are too low. Perhaps the simplest way to get a read on investors' expectations of a business is to look at its Price to Earnings Ratio (PE Ratio). A high P/E implies that investors have high expectations of what a company can achieve compared to a company with a low P/E ratio.
View our latest analysis for Kering
Does Kering Have A Relatively High Or Low P/E For Its Industry?
Kering has a P/E ratio of 22.10. As you can see below Kering has a P/E ratio that is fairly close for the average for the luxury industry, which is 21.6.
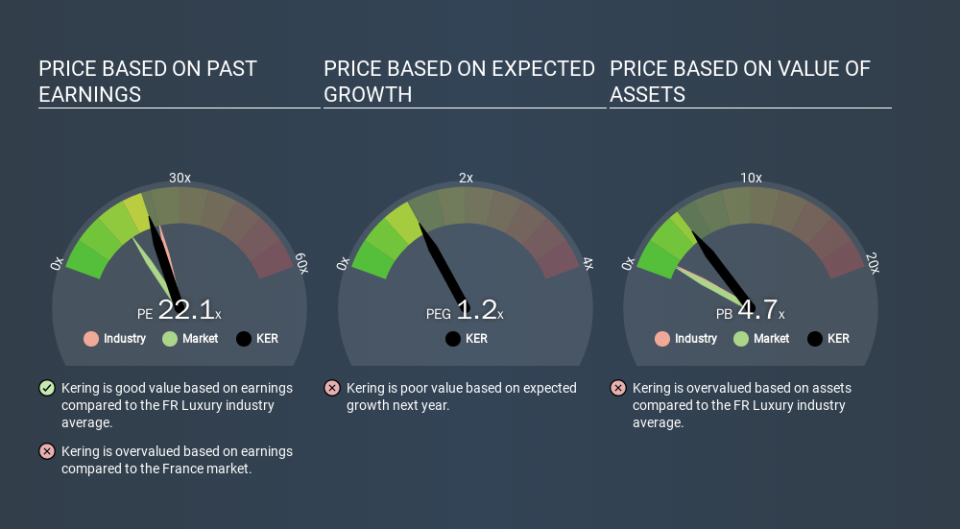
Kering's P/E tells us that market participants think its prospects are roughly in line with its industry. If the company has better than average prospects, then the market might be underestimating it. I would further inform my view by checking insider buying and selling., among other things.
How Growth Rates Impact P/E Ratios
Generally speaking the rate of earnings growth has a profound impact on a company's P/E multiple. When earnings grow, the 'E' increases, over time. That means unless the share price increases, the P/E will reduce in a few years. So while a stock may look expensive based on past earnings, it could be cheap based on future earnings.
Kering saw earnings per share decrease by 16% last year. But it has grown its earnings per share by 17% per year over the last five years.
Don't Forget: The P/E Does Not Account For Debt or Bank Deposits
It's important to note that the P/E ratio considers the market capitalization, not the enterprise value. That means it doesn't take debt or cash into account. Theoretically, a business can improve its earnings (and produce a lower P/E in the future) by investing in growth. That means taking on debt (or spending its cash).
Such expenditure might be good or bad, in the long term, but the point here is that the balance sheet is not reflected by this ratio.
So What Does Kering's Balance Sheet Tell Us?
Kering has net debt worth just 5.8% of its market capitalization. So it doesn't have as many options as it would with net cash, but its debt would not have much of an impact on its P/E ratio.
The Verdict On Kering's P/E Ratio
Kering trades on a P/E ratio of 22.1, which is above its market average of 14.2. With some debt but no EPS growth last year, the market has high expectations of future profits. Given Kering's P/E ratio has declined from 32.3 to 22.1 in the last month, we know for sure that the market is significantly less confident about the business today, than it was back then. For those who don't like to trade against momentum, that could be a warning sign, but a contrarian investor might want to take a closer look.
Investors have an opportunity when market expectations about a stock are wrong. As value investor Benjamin Graham famously said, 'In the short run, the market is a voting machine but in the long run, it is a weighing machine. So this free visual report on analyst forecasts could hold the key to an excellent investment decision.
Of course you might be able to find a better stock than Kering. So you may wish to see this free collection of other companies that have grown earnings strongly.
If you spot an error that warrants correction, please contact the editor at editorial-team@simplywallst.com. This article by Simply Wall St is general in nature. It does not constitute a recommendation to buy or sell any stock, and does not take account of your objectives, or your financial situation. Simply Wall St has no position in the stocks mentioned.
We aim to bring you long-term focused research analysis driven by fundamental data. Note that our analysis may not factor in the latest price-sensitive company announcements or qualitative material. Thank you for reading.
