
 Yahoo Finance
 Kennametal (KMT) Q3 Earnings Beat Estimates, Revenues Up Y/Y

Kennametal Inc. KMT reported impressive results for third-quarter fiscal 2023 (ended Mar 31, 2023). KMT’s earnings beat the Zacks Consensus Estimate by 14.7% and quarterly sales beat estimates by 1.1%.
Adjusted earnings in the quarter under review were 39 cents per share, beating the Zacks Consensus Estimate of earnings of 34 cents per share. The bottom line decreased 17% from the year-ago figure.
Revenue Details
In the quarter under review, Kennametal’s revenues were $536 million, reflecting an increase of 5% from the year-ago quarter’s figure. Organic sales in the quarter grew 8%. Foreign currency headwind left an adverse impact of 4% while favorable business days supported sales by 1%. Business in energy, general engineering, transportation and aerospace markets flourished in the quarter.
KMT’s revenues beat the Zacks Consensus Estimate of $530 million.
On a geographical basis, its revenues from American operations increased 8% year over year to $269.5 million, whereas sales from Europe, the Middle East and Africa region were $163.9 million, up 7% from the year-ago quarter’s reading. Sales from the Asia Pacific belt decreased 6% to $102.7 million.
Kennametal reports results under two business segments, namely Metal Cutting and Infrastructure. Its segmental performance for the fiscal third quarter is briefly discussed below:
The Metal Cutting segment’s revenues of $333.5 million increased 6.3% year over year. Organic sales growth in the quarter was 10%. Forex woes had an adverse impact of 5% and favorable business days supported sales by 1%.
The Infrastructure segment’s revenues totaled $202.5 million, increasing 2.1% year over year. The results gained from 5% growth in organic sales, while foreign currency movements had an adverse impact of 3%.
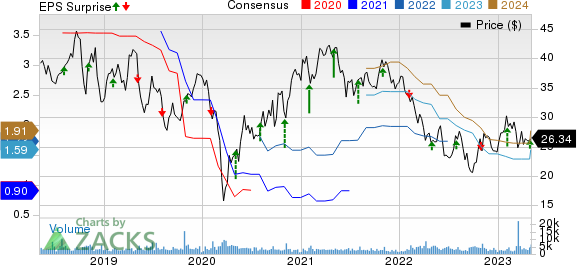
Kennametal Inc. Price, Consensus and EPS Surprise
Kennametal Inc. price-consensus-eps-surprise-chart | Kennametal Inc. Quote
Margin Profile
Kennametal’s cost of goods sold in the reported quarter increased 5.9% year over year to $368.1 million. The same represented 68.7% of revenues, compared with 67.9% in the year-ago quarter. The gross profit increased 2% year over year to $167.9 million wherein the margin contracted 80 basis points (bps) to 31.3%. Operating expenses were $113 million in the quarter under review, up 5.6% year over year. As a percentage of revenues, operating expenses were 21.2%, compared with 20.9% a year ago.
The operating income decreased 1.7% year over year to $52.5 million. Operating margin decreased 60 bps year over year to 9.8%. High raw material costs, wages, general inflation and foreign currency exchange headwinds were spoilsports.
Interest expenses in the reported quarter were $7.7 million, up 20.4% from the year-ago quarter’s figure. The adjusted effective tax rate was 24.4% in the quarter under review, down from 28.3% in the prior-year quarter.
Balance Sheet and Cash Flow
While exiting the fiscal third quarter, Kennametal’s cash and cash equivalents were $93.5 million, up 9.2% from the fourth-quarter fiscal 2022’s figure of $85.6 million. Long-term debt was $595 million, almost in line with the $594.4 million reported in the fiscal fourth quarter of 2022.
In the first nine months of fiscal 2023, Kennametal generated net cash of $126.2 million in operating activities, compared with $93 million net cash generated in the previous fiscal year’s quarter. Capital invested in purchasing property, plant and equipment (net of the amount received on disposals) was $71.1 million, up 18.1% from $60.2 million in the prior fiscal year. Free operating cash flow was $56 million, compared with $13 million in the previous fiscal year’s period.
In the fiscal third quarter of 2023, KMT’s dividend payments totaled $48.5 million and it repurchased shares worth $37.6 million.
Kennametal announced that its board of directors approved a quarterly cash dividend of 20 cents per share to its shareholders of record as of May 09, 2023. The disbursement will be made on May 23.
2023 Guidance
In fiscal 2023 (ending June 2023), favorable pricing is anticipated to offset inflation related to wage and raw material costs. The company anticipates sales of $2.07-$2.10 billion, compared with $2.05- $2.10 billion predicted earlier, which includes a currency headwind of approximately $100 million. Adjusted earnings per share are anticipated to be $1.50-$1.70, compared with $1.30-$1.70 anticipated before. The midpoint of the guided range of $1.50 per share implies a 15.7% decline from the fiscal 2022 figure of $1.78 per share. The adjusted tax rate is anticipated to be approximately 24% in the full fiscal, compared with 27.2% in fiscal 2022. Free operating cash flow is expected to be approximately 100% of net income (adjusted).
Capital spending is expected to be approximately $100 million in the current fiscal year, compared with $97 million reported in fiscal 2022.
Zacks Rank & Other Stocks to Consider
KMT currently sports a Zacks Rank #1 (Strong Buy). Some other top-ranked companies from the Industrial Products sector are discussed below:
Ingersoll Rand Inc. IR presently sports a Zacks Rank of 1. You can see the complete list of today’s Zacks #1 Rank stocks.
IR’s earnings surprise in the last four quarters was 8.5%, on average. In the past 60 days, estimates for Ingersoll Rand’s 2023 earnings have increased 3.3%. The stock has rallied 7.2% in the past six months.
Parker-Hannifin Corporation PH presently carries a Zacks Rank #2 (Buy). The company delivered a trailing four-quarter earnings surprise of 9.1%, on average.
In the past 60 days, estimates for Parker-Hannifin’s fiscal 2023 (ending June 2023) earnings have increased 0.5%. The stock has gained 7.2% in the past six months.
Want the latest recommendations from Zacks Investment Research? Today, you can download 7 Best Stocks for the Next 30 Days. Click to get this free report
Parker-Hannifin Corporation (PH) : Free Stock Analysis Report
Ingersoll Rand Inc. (IR) : Free Stock Analysis Report
Kennametal Inc. (KMT) : Free Stock Analysis Report
