
 Yahoo Finance
 Kelt Exploration Ltd.'s (TSE:KEL) Stock On An Uptrend: Could Fundamentals Be Driving The Momentum?
Kelt Exploration (TSE:KEL) has had a great run on the share market with its stock up by a significant 41% over the last three months. Given that stock prices are usually aligned with a company's financial performance in the long-term, we decided to study its financial indicators more closely to see if they had a hand to play in the recent price move. Particularly, we will be paying attention to Kelt Exploration's ROE today.
Return on Equity or ROE is a test of how effectively a company is growing its value and managing investors’ money. In other words, it is a profitability ratio which measures the rate of return on the capital provided by the company's shareholders.
Check out our latest analysis for Kelt Exploration
How Is ROE Calculated?
The formula for ROE is:
Return on Equity = Net Profit (from continuing operations) ÷ Shareholders' Equity
So, based on the above formula, the ROE for Kelt Exploration is:
16% = CA$114m ÷ CA$723m (Based on the trailing twelve months to December 2021).
The 'return' is the profit over the last twelve months. Another way to think of that is that for every CA$1 worth of equity, the company was able to earn CA$0.16 in profit.
What Has ROE Got To Do With Earnings Growth?
So far, we've learned that ROE is a measure of a company's profitability. Based on how much of its profits the company chooses to reinvest or "retain", we are then able to evaluate a company's future ability to generate profits. Assuming all else is equal, companies that have both a higher return on equity and higher profit retention are usually the ones that have a higher growth rate when compared to companies that don't have the same features.
A Side By Side comparison of Kelt Exploration's Earnings Growth And 16% ROE
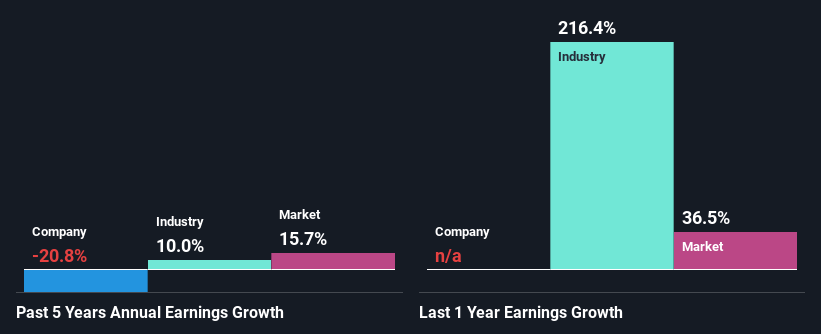
To begin with, Kelt Exploration seems to have a respectable ROE. Further, the company's ROE is similar to the industry average of 18%. As you might expect, the 21% net income decline reported by Kelt Exploration is a bit of a surprise. We reckon that there could be some other factors at play here that are preventing the company's growth. Such as, the company pays out a huge portion of its earnings as dividends, or is faced with competitive pressures.
That being said, we compared Kelt Exploration's performance with the industry and were concerned when we found that while the company has shrunk its earnings, the industry has grown its earnings at a rate of 10.0% in the same period.
Earnings growth is a huge factor in stock valuation. It’s important for an investor to know whether the market has priced in the company's expected earnings growth (or decline). By doing so, they will have an idea if the stock is headed into clear blue waters or if swampy waters await. One good indicator of expected earnings growth is the P/E ratio which determines the price the market is willing to pay for a stock based on its earnings prospects. So, you may want to check if Kelt Exploration is trading on a high P/E or a low P/E, relative to its industry.
Is Kelt Exploration Making Efficient Use Of Its Profits?
Kelt Exploration doesn't pay any dividend, meaning that the company is keeping all of its profits, which makes us wonder why it is retaining its earnings if it can't use them to grow its business. It looks like there might be some other reasons to explain the lack in that respect. For example, the business could be in decline.
Conclusion
On the whole, we do feel that Kelt Exploration has some positive attributes. Yet, the low earnings growth is a bit concerning, especially given that the company has a high rate of return and is reinvesting ma huge portion of its profits. By the looks of it, there could be some other factors, not necessarily in control of the business, that's preventing growth. While we won't completely dismiss the company, what we would do, is try to ascertain how risky the business is to make a more informed decision around the company. Our risks dashboard would have the 2 risks we have identified for Kelt Exploration.
Have feedback on this article? Concerned about the content? Get in touch with us directly. Alternatively, email editorial-team (at) simplywallst.com.
This article by Simply Wall St is general in nature. We provide commentary based on historical data and analyst forecasts only using an unbiased methodology and our articles are not intended to be financial advice. It does not constitute a recommendation to buy or sell any stock, and does not take account of your objectives, or your financial situation. We aim to bring you long-term focused analysis driven by fundamental data. Note that our analysis may not factor in the latest price-sensitive company announcements or qualitative material. Simply Wall St has no position in any stocks mentioned.
