
 Yahoo Finance
 Are Kelt Exploration Ltd. (TSE:KEL) Investors Paying Above The Intrinsic Value?

Want to participate in a short research study? Help shape the future of investing tools and you could win a $250 gift card!
Today we'll do a simple run through of a valuation method used to estimate the attractiveness of Kelt Exploration Ltd. (TSE:KEL) as an investment opportunity by taking the foreast future cash flows of the company and discounting them back to today's value. This is done using the Discounted Cash Flow (DCF) model. It may sound complicated, but actually it is quite simple!
Companies can be valued in a lot of ways, so we would point out that a DCF is not perfect for every situation. Anyone interested in learning a bit more about intrinsic value should have a read of the Simply Wall St analysis model.
See our latest analysis for Kelt Exploration
Crunching the numbers
We are going to use a two-stage DCF model, which, as the name states, takes into account two stages of growth. The first stage is generally a higher growth period which levels off heading towards the terminal value, captured in the second 'steady growth' period. To begin with, we have to get estimates of the next ten years of cash flows. Where possible we use analyst estimates, but when these aren't available we extrapolate the previous free cash flow (FCF) from the last estimate or reported value. We assume companies with shrinking free cash flow will slow their rate of shrinkage, and that companies with growing free cash flow will see their growth rate slow, over this period. We do this to reflect that growth tends to slow more in the early years than it does in later years.
Generally we assume that a dollar today is more valuable than a dollar in the future, and so the sum of these future cash flows is then discounted to today's value:
10-year free cash flow (FCF) estimate
2019 | 2020 | 2021 | 2022 | 2023 | 2024 | 2025 | 2026 | 2027 | 2028 | |
Levered FCF (CA$, Millions) | CA$-29.00 | CA$-23.00 | CA$44.00 | CA$48.00 | CA$51.20 | CA$53.90 | CA$56.19 | CA$58.20 | CA$59.99 | CA$61.64 |
Growth Rate Estimate Source | Analyst x2 | Analyst x3 | Analyst x1 | Analyst x1 | Est @ 6.68% | Est @ 5.26% | Est @ 4.26% | Est @ 3.57% | Est @ 3.08% | Est @ 2.74% |
Present Value (CA$, Millions) Discounted @ 8.55% | CA$-26.72 | CA$-19.52 | CA$34.40 | CA$34.57 | CA$33.97 | CA$32.94 | CA$31.64 | CA$30.18 | CA$28.66 | CA$27.13 |
Present Value of 10-year Cash Flow (PVCF)= CA$207.26m
"Est" = FCF growth rate estimated by Simply Wall St
We now need to calculate the Terminal Value, which accounts for all the future cash flows after this ten year period. The Gordon Growth formula is used to calculate Terminal Value at a future annual growth rate equal to the 10-year government bond rate of 1.9%. We discount the terminal cash flows to today's value at a cost of equity of 8.6%.
Terminal Value (TV) = FCF2029 × (1 + g) ÷ (r – g) = CA$62m × (1 + 1.9%) ÷ (8.6% – 1.9%) = CA$951m
Present Value of Terminal Value (PVTV) = TV / (1 + r)10 = CA$CA$951m ÷ ( 1 + 8.6%)10 = CA$418.69m
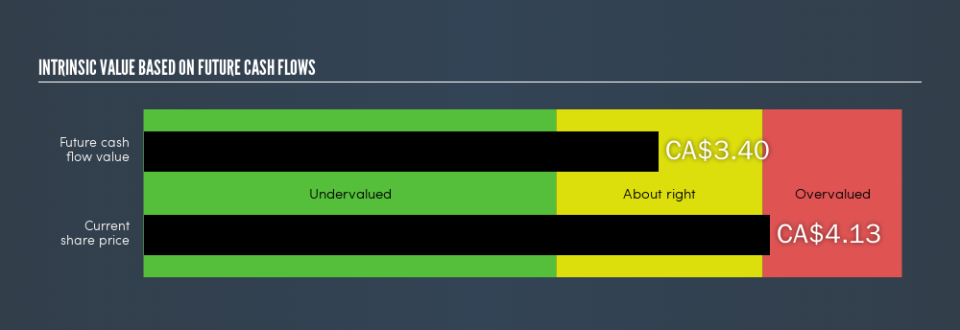
The total value, or equity value, is then the sum of the present value of the future cash flows, which in this case is CA$625.95m. The last step is to then divide the equity value by the number of shares outstanding. This results in an intrinsic value estimate of CA$3.4. Relative to the current share price of CA$4.13, the company appears slightly overvalued at the time of writing. Remember though, that this is just an approximate valuation, and like any complex formula - garbage in, garbage out.
Important assumptions
Now the most important inputs to a discounted cash flow are the discount rate, and of course, the actual cash flows. You don't have to agree with these inputs, I recommend redoing the calculations yourself and playing with them. The DCF also does not consider the possible cyclicality of an industry, or a company's future capital requirements, so it does not give a full picture of a company's potential performance. Given that we are looking at Kelt Exploration as potential shareholders, the cost of equity is used as the discount rate, rather than the cost of capital (or weighted average cost of capital, WACC) which accounts for debt. In this calculation we've used 8.6%, which is based on a levered beta of 1.108. Beta is a measure of a stock's volatility, compared to the market as a whole. We get our beta from the industry average beta of globally comparable companies, with an imposed limit between 0.8 and 2.0, which is a reasonable range for a stable business.
Next Steps:
Whilst important, DCF calculation shouldn’t be the only metric you look at when researching a company. The DCF model is not a perfect stock valuation tool. Rather it should be seen as a guide to "what assumptions need to be true for this stock to be under/overvalued?" If a company grows at a different rate, or if its cost of equity or risk free rate changes sharply, the output can look very different. What is the reason for the share price to differ from the intrinsic value? For Kelt Exploration, I've compiled three additional aspects you should further research:
Financial Health: Does KEL have a healthy balance sheet? Take a look at our free balance sheet analysis with six simple checks on key factors like leverage and risk.
Future Earnings: How does KEL's growth rate compare to its peers and the wider market? Dig deeper into the analyst consensus number for the upcoming years by interacting with our free analyst growth expectation chart.
Other High Quality Alternatives: Are there other high quality stocks you could be holding instead of KEL? Explore our interactive list of high quality stocks to get an idea of what else is out there you may be missing!
PS. The Simply Wall St app conducts a discounted cash flow valuation for every stock on the TSE every day. If you want to find the calculation for other stocks just search here.
We aim to bring you long-term focused research analysis driven by fundamental data. Note that our analysis may not factor in the latest price-sensitive company announcements or qualitative material.
If you spot an error that warrants correction, please contact the editor at editorial-team@simplywallst.com. This article by Simply Wall St is general in nature. It does not constitute a recommendation to buy or sell any stock, and does not take account of your objectives, or your financial situation. Simply Wall St has no position in the stocks mentioned. Thank you for reading.
