
 Yahoo Finance
 Is Kelso Technologies Inc.'s (TSE:KLS) CEO Being Overpaid?

In 2010 Rik Bond was appointed CEO of Kelso Technologies Inc. (TSE:KLS). First, this article will compare CEO compensation with compensation at similar sized companies. After that, we will consider the growth in the business. And finally - as a second measure of performance - we will look at the returns shareholders have received over the last few years. The aim of all this is to consider the appropriateness of CEO pay levels.
View our latest analysis for Kelso Technologies
How Does Rik Bond's Compensation Compare With Similar Sized Companies?
According to our data, Kelso Technologies Inc. has a market capitalization of CA$46m, and pays its CEO total annual compensation worth US$236k. (This is based on the year to December 2018). We think total compensation is more important but we note that the CEO salary is lower, at US$180k. We looked at a group of companies with market capitalizations under US$200m, and the median CEO total compensation was US$121k.
Thus we can conclude that Rik Bond receives more in total compensation than the median of a group of companies in the same market, and of similar size to Kelso Technologies Inc.. However, this doesn't necessarily mean the pay is too high. We can better assess whether the pay is overly generous by looking into the underlying business performance.
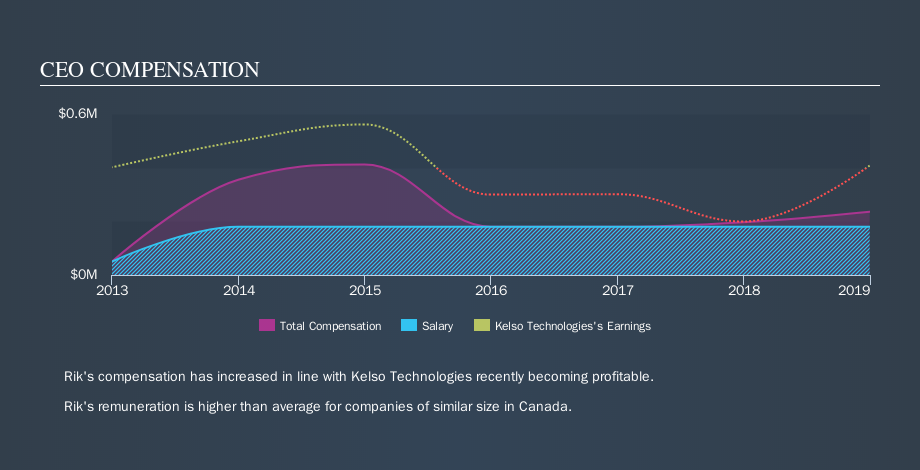
The graphic below shows how CEO compensation at Kelso Technologies has changed from year to year.
Is Kelso Technologies Inc. Growing?
On average over the last three years, Kelso Technologies Inc. has grown earnings per share (EPS) by 53% each year (using a line of best fit). In the last year, its revenue is up 113%.
This shows that the company has improved itself over the last few years. Good news for shareholders. It's great to see that revenue growth is strong, too. These metrics suggest the business is growing strongly. Although we don't have analyst forecasts, you could get a better understanding of its growth by checking out this more detailed historical graph of earnings, revenue and cash flow.
Has Kelso Technologies Inc. Been A Good Investment?
Since shareholders would have lost about 33% over three years, some Kelso Technologies Inc. shareholders would surely be feeling negative emotions. This suggests it would be unwise for the company to pay the CEO too generously.
In Summary...
We compared total CEO remuneration at Kelso Technologies Inc. with the amount paid at companies with a similar market capitalization. We found that it pays well over the median amount paid in the benchmark group.
However we must not forget that the EPS growth has been very strong over three years. On the other hand returns to investors over the same period have probably disappointed many. While EPS is positive, we'd say shareholders would want better returns before the CEO is paid much more. Whatever your view on compensation, you might want to check if insiders are buying or selling Kelso Technologies shares (free trial).
Arguably, business quality is much more important than CEO compensation levels. So check out this free list of interesting companies, that have HIGH return on equity and low debt.
We aim to bring you long-term focused research analysis driven by fundamental data. Note that our analysis may not factor in the latest price-sensitive company announcements or qualitative material.
If you spot an error that warrants correction, please contact the editor at editorial-team@simplywallst.com. This article by Simply Wall St is general in nature. It does not constitute a recommendation to buy or sell any stock, and does not take account of your objectives, or your financial situation. Simply Wall St has no position in the stocks mentioned. Thank you for reading.
