
 Yahoo Finance
 K&S Corporation Limited's (ASX:KSC) Has Had A Decent Run On The Stock market: Are Fundamentals In The Driver's Seat?
K&S' (ASX:KSC) stock is up by 9.5% over the past three months. Given that stock prices are usually aligned with a company's financial performance in the long-term, we decided to investigate if the company's decent financials had a hand to play in the recent price move. Particularly, we will be paying attention to K&S' ROE today.
ROE or return on equity is a useful tool to assess how effectively a company can generate returns on the investment it received from its shareholders. In simpler terms, it measures the profitability of a company in relation to shareholder's equity.
View our latest analysis for K&S
How Is ROE Calculated?
The formula for ROE is:
Return on Equity = Net Profit (from continuing operations) ÷ Shareholders' Equity
So, based on the above formula, the ROE for K&S is:
6.7% = AU$18m ÷ AU$269m (Based on the trailing twelve months to June 2021).
The 'return' is the yearly profit. That means that for every A$1 worth of shareholders' equity, the company generated A$0.07 in profit.
What Is The Relationship Between ROE And Earnings Growth?
So far, we've learned that ROE is a measure of a company's profitability. We now need to evaluate how much profit the company reinvests or "retains" for future growth which then gives us an idea about the growth potential of the company. Assuming everything else remains unchanged, the higher the ROE and profit retention, the higher the growth rate of a company compared to companies that don't necessarily bear these characteristics.
K&S' Earnings Growth And 6.7% ROE
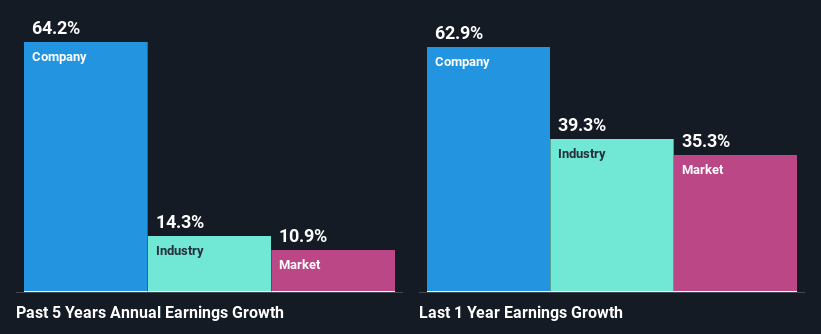
At first glance, K&S' ROE doesn't look very promising. A quick further study shows that the company's ROE doesn't compare favorably to the industry average of 9.2% either. In spite of this, K&S was able to grow its net income considerably, at a rate of 64% in the last five years. So, there might be other aspects that are positively influencing the company's earnings growth. For example, it is possible that the company's management has made some good strategic decisions, or that the company has a low payout ratio.
Next, on comparing with the industry net income growth, we found that K&S' growth is quite high when compared to the industry average growth of 13% in the same period, which is great to see.
Earnings growth is an important metric to consider when valuing a stock. The investor should try to establish if the expected growth or decline in earnings, whichever the case may be, is priced in. By doing so, they will have an idea if the stock is headed into clear blue waters or if swampy waters await. One good indicator of expected earnings growth is the P/E ratio which determines the price the market is willing to pay for a stock based on its earnings prospects. So, you may want to check if K&S is trading on a high P/E or a low P/E, relative to its industry.
Is K&S Using Its Retained Earnings Effectively?
The three-year median payout ratio for K&S is 31%, which is moderately low. The company is retaining the remaining 69%. So it seems that K&S is reinvesting efficiently in a way that it sees impressive growth in its earnings (discussed above) and pays a dividend that's well covered.
Moreover, K&S is determined to keep sharing its profits with shareholders which we infer from its long history of paying a dividend for at least ten years.
Summary
On the whole, we do feel that K&S has some positive attributes. With a high rate of reinvestment, albeit at a low ROE, the company has managed to see a considerable growth in its earnings. While we won't completely dismiss the company, what we would do, is try to ascertain how risky the business is to make a more informed decision around the company. Our risks dashboard will have the 1 risk we have identified for K&S.
This article by Simply Wall St is general in nature. We provide commentary based on historical data and analyst forecasts only using an unbiased methodology and our articles are not intended to be financial advice. It does not constitute a recommendation to buy or sell any stock, and does not take account of your objectives, or your financial situation. We aim to bring you long-term focused analysis driven by fundamental data. Note that our analysis may not factor in the latest price-sensitive company announcements or qualitative material. Simply Wall St has no position in any stocks mentioned.
Have feedback on this article? Concerned about the content? Get in touch with us directly. Alternatively, email editorial-team (at) simplywallst.com.
