
 Yahoo Finance
 Journey Energy (TSE:JOY) shareholders have earned a 427% return over the last year
While some are satisfied with an index fund, active investors aim to find truly magnificent investments on the stock market. When you buy and hold the right company, the returns can make a huge difference to both you and your family. For example, the Journey Energy Inc. (TSE:JOY) share price rocketed moonwards 427% in just one year. And in the last month, the share price has gained 42%. This could be related to the recent financial results that were recently released - you could check the most recent data by reading our company report. And shareholders have also done well over the long term, with an increase of 179% in the last three years.
So let's investigate and see if the longer term performance of the company has been in line with the underlying business' progress.
View our latest analysis for Journey Energy
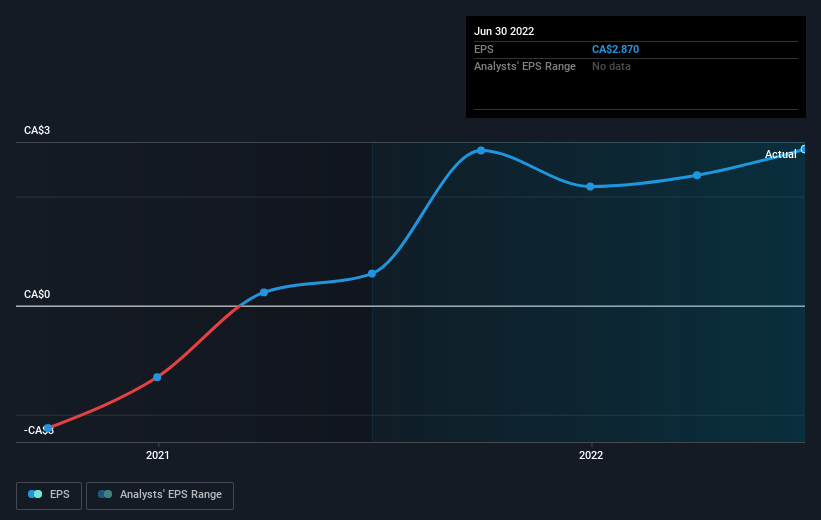
To paraphrase Benjamin Graham: Over the short term the market is a voting machine, but over the long term it's a weighing machine. By comparing earnings per share (EPS) and share price changes over time, we can get a feel for how investor attitudes to a company have morphed over time.
During the last year Journey Energy grew its earnings per share (EPS) by 388%. We note that the earnings per share growth isn't far from the share price growth (of 427%). That suggests that the market sentiment around the company hasn't changed much over that time. It looks like the share price is responding to the EPS.
You can see how EPS has changed over time in the image below (click on the chart to see the exact values).
It's good to see that there was some significant insider buying in the last three months. That's a positive. On the other hand, we think the revenue and earnings trends are much more meaningful measures of the business. Before buying or selling a stock, we always recommend a close examination of historic growth trends, available here..
A Different Perspective
It's good to see that Journey Energy has rewarded shareholders with a total shareholder return of 427% in the last twelve months. That's better than the annualised return of 30% over half a decade, implying that the company is doing better recently. Given the share price momentum remains strong, it might be worth taking a closer look at the stock, lest you miss an opportunity. It's always interesting to track share price performance over the longer term. But to understand Journey Energy better, we need to consider many other factors. Consider for instance, the ever-present spectre of investment risk. We've identified 2 warning signs with Journey Energy (at least 1 which is a bit concerning) , and understanding them should be part of your investment process.
Journey Energy is not the only stock insiders are buying. So take a peek at this free list of growing companies with insider buying.
Please note, the market returns quoted in this article reflect the market weighted average returns of stocks that currently trade on CA exchanges.
Have feedback on this article? Concerned about the content? Get in touch with us directly. Alternatively, email editorial-team (at) simplywallst.com.
This article by Simply Wall St is general in nature. We provide commentary based on historical data and analyst forecasts only using an unbiased methodology and our articles are not intended to be financial advice. It does not constitute a recommendation to buy or sell any stock, and does not take account of your objectives, or your financial situation. We aim to bring you long-term focused analysis driven by fundamental data. Note that our analysis may not factor in the latest price-sensitive company announcements or qualitative material. Simply Wall St has no position in any stocks mentioned.
Join A Paid User Research Session
You’ll receive a US$30 Amazon Gift card for 1 hour of your time while helping us build better investing tools for the individual investors like yourself. Sign up here
